On this page
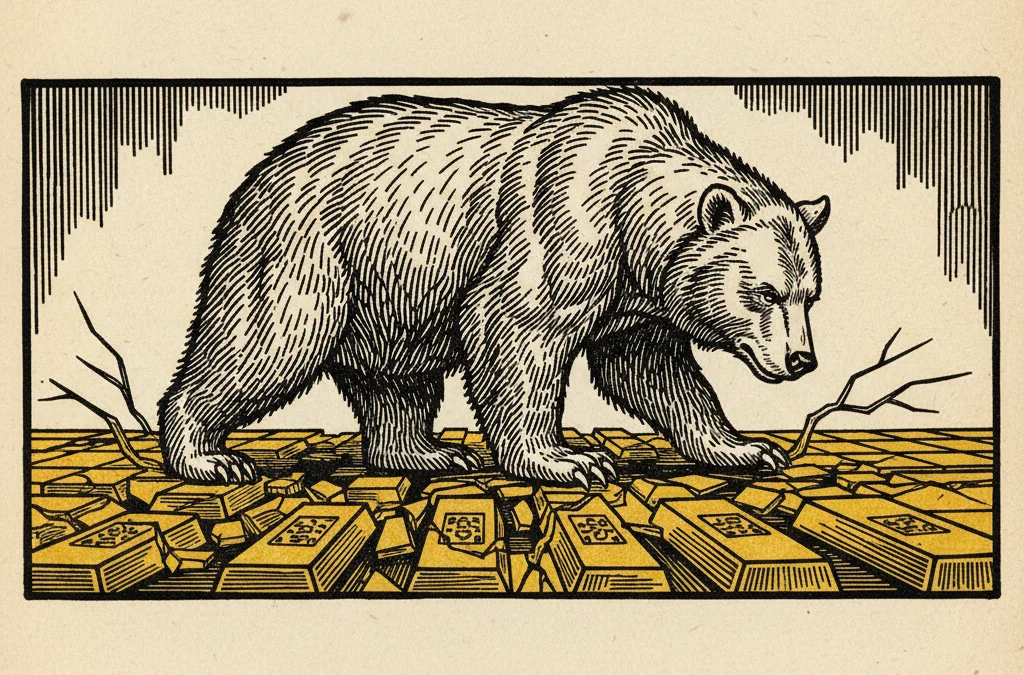
Gold Suffers Worst Weekly Drop in 40 Years
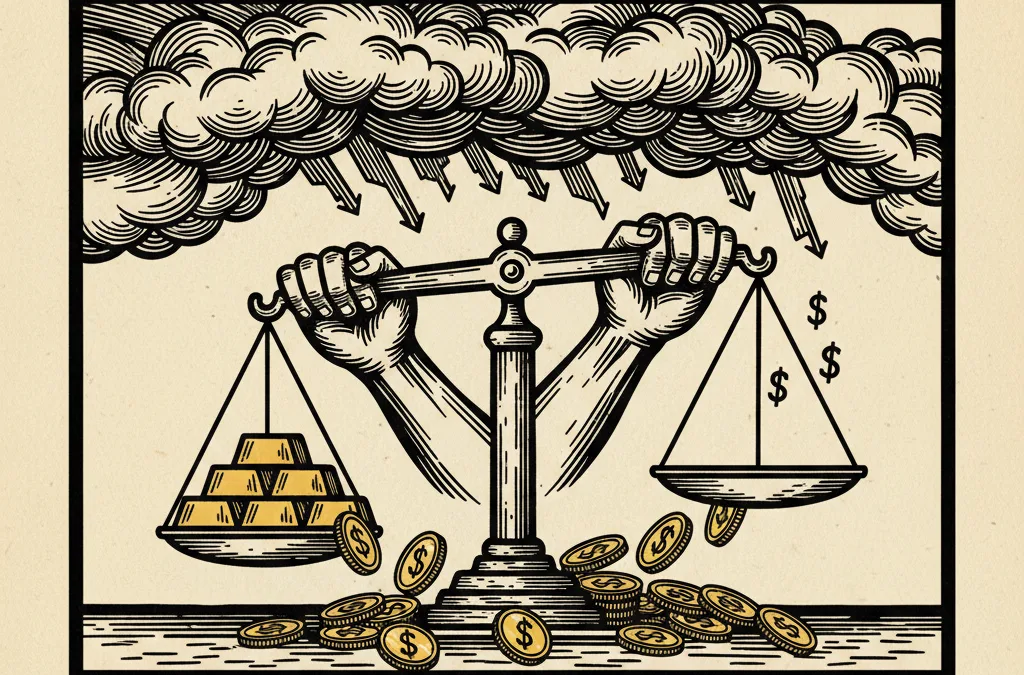
Gold has plunged to a four-month low near $3,239 as surging oil prices and escalating Middle East tensions trigger the most brutal weekly selloff since the mid-1980s, upending the metal’s traditional safe-haven narrative.
What to know
-
Gold has fallen to around $3,239/oz, its lowest level in four months, capping the worst weekly decline in approximately 40 years.
-
Surging crude oil prices linked to escalating Middle East tensions appear to be the primary catalyst, forcing liquidation across precious metals.
-
Silver, platinum, and palladium are all showing weakness, with the gold/silver ratio compressing to 66.6 - suggesting broad-based precious metals stress rather than a gold-specific event.
What happened
Gold has cratered to around $3,239/oz - a level not seen since late November 2025 - in what marks the sharpest weekly decline the gold price has recorded in four decades. Weekly drops of this magnitude haven’t been seen since the volatile unwind of the early-to-mid 1980s, when gold was still adjusting to life after the Nixon-era price controls.
The trigger is a sharp surge in crude oil prices driven by intensifying Middle East tensions. While the specifics of the geopolitical escalation are still developing, the market response has been decisive and broad. Silver sits at $63.67/oz, platinum at $1,779/oz, and palladium at $1,371/oz - all under pressure. The gold/silver ratio has compressed to 66.6, which is notably tight by recent standards and suggests this is a sector-wide deleveraging event rather than isolated gold weakness.
Who’s involved
The selling pressure appears to be coming from multiple directions simultaneously. Momentum-driven funds that had been riding gold’s multi-year rally are likely hitting stop-losses and unwinding leveraged positions. When oil spikes sharply, it introduces inflation expectations that can paradoxically hurt gold by raising the prospect of tighter monetary policy - or at least delaying anticipated rate cuts.
Central banks, which have been consistent buyers throughout 2024 and 2025, are unlikely to be sellers here. But their steady accumulation alone cannot absorb the kind of volume that algorithmic and speculative liquidation generates in a compressed timeframe.
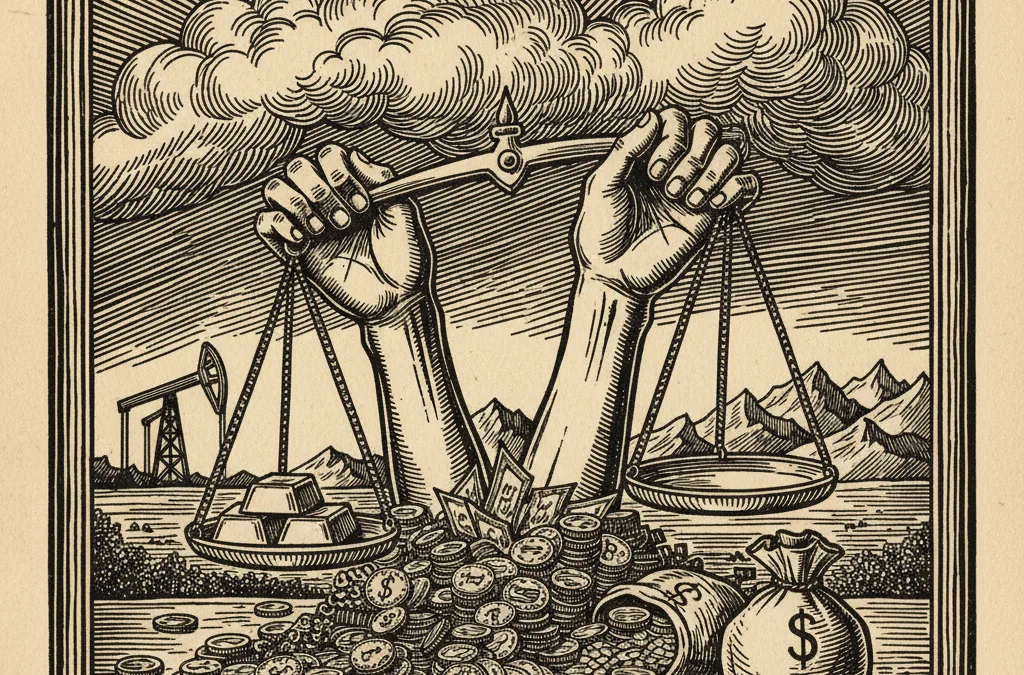
Energy markets are the other key player. Crude’s surge is acting as a capital magnet, pulling speculative money away from precious metals and into oil futures. This dynamic - where geopolitical risk benefits energy at gold’s expense - is unusual but not unprecedented. It occurred briefly during the 2022 Ukraine-driven energy crisis before gold eventually reasserted itself.
Why it matters
A 40-year record is not noise - it signals a structural repositioning. Gold has spent the better part of two years grinding higher on central bank demand, de-dollarisation flows, and geopolitical hedging. For the metal to sell off this hard on the very type of geopolitical stress that typically supports it raises questions about positioning and valuation.
One interpretation is that gold had simply run too far, too fast. At levels above $4,500 earlier this year, the metal was pricing in a near-perfect bullish scenario. The oil surge may have been the catalyst, but the vulnerability was already there. Crowded long positioning in futures markets tends to amplify moves in both directions.
There is also a liquidity dimension. When oil surges, margin calls across commodity portfolios can force selling of profitable positions - and gold, having rallied substantially, would be a natural source of funds. This forced liquidation dynamic can overshoot fundamentals significantly.
Japan’s upcoming inflation data, due imminently, adds another layer. A hot reading could strengthen the yen and add further pressure to dollar-denominated gold, while a soft print might offer some respite.
What to watch
The $3,200 level is the immediate line in the sand. A clean break below would open up a move toward $3,050 - $3,100, where buyers stepped in during late October 2025. Holding above $3,200 on a closing basis would suggest the worst of the liquidation is passing.
Oil price trajectory matters enormously here. If crude stabilises, gold’s safe-haven bid should gradually reassert itself as the geopolitical premium returns to where it traditionally sits - in bullion, not barrels.
The gold/silver ratio at 66.6 is compressed relative to recent months. If it starts expanding again - silver falling faster than gold - that would signal deeper risk-off sentiment and potentially more downside ahead. Conversely, stability here suggests the selloff is maturing.
Weekly CFTC positioning data, due shortly, will reveal just how much speculative length has been unwound. Whether this move has further to run depends largely on what that report shows.
This article is for informational purposes only and does not constitute financial advice. Always do your own research before making investment decisions.