On this page

Gold’s Worst Week in 14 Years - Despite a War
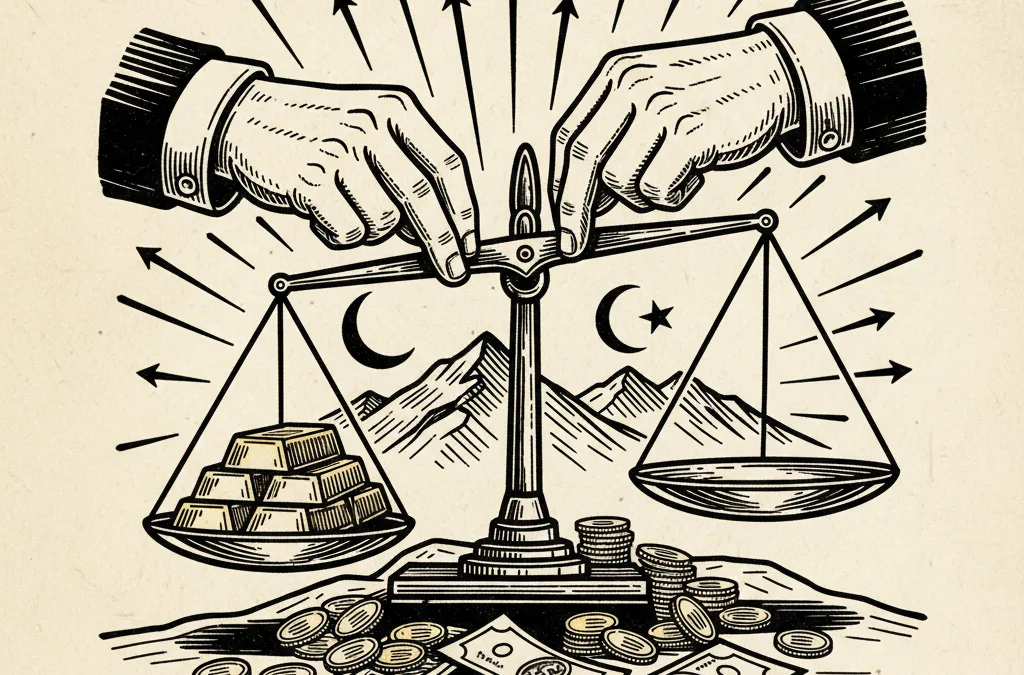
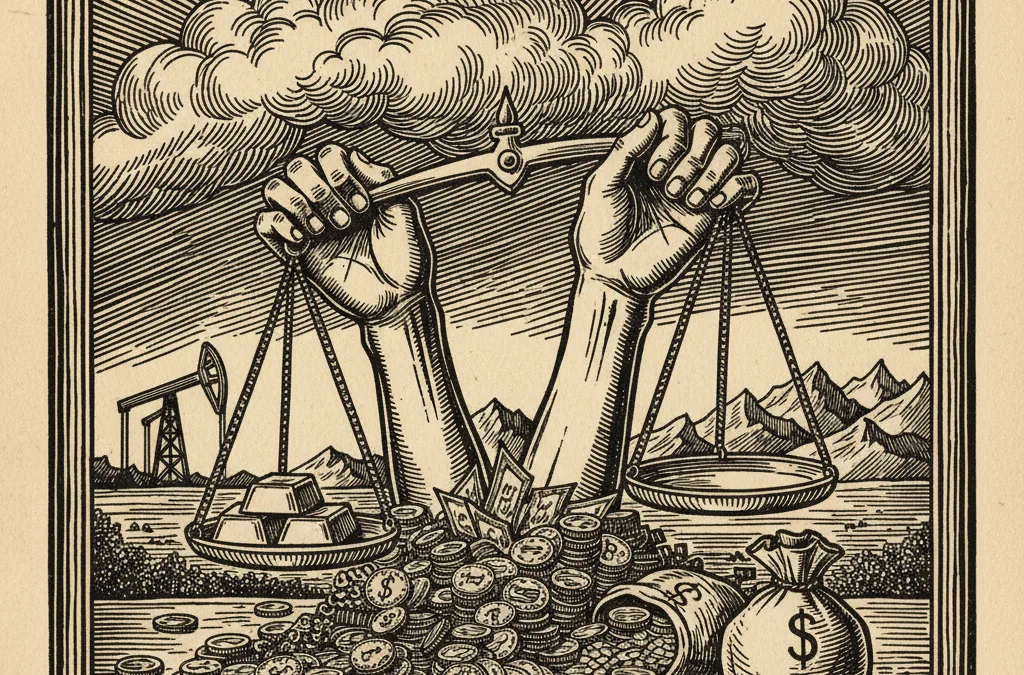
Gold has shed over 8% in a single week - its steepest decline since 2012 - even as geopolitical risk intensifies, raising uncomfortable questions about the metal’s safe-haven credentials at elevated price levels.
What to know
-
Gold fell 8.39% this week to $4,574.90/oz, its largest weekly percentage drop in over 14 years, having traded as high as $5,405 earlier this month.
-
Silver has been hit even harder, down 13.21% on the week and nearly 20% over the past month, pushing the gold/silver ratio to 65.7.
-
Fed Chair Powell speaks later today, with markets watching for any signal on rate direction that could determine whether this selloff deepens or stabilises.
What happened
Gold has just posted its worst weekly performance since late 2011, dropping $419 to $4,574.90/oz - a decline of 8.39% in five sessions. The move has occurred against a backdrop of active military conflict, the very scenario that is supposed to drive safe-haven demand into overdrive.
The gold price peaked at $5,405 earlier this month before the rout began. Over the past 30 days, the metal has shed $629.80 - a 12.10% drawdown that has wiped out months of gains in a matter of weeks. Intraday volatility has been savage, with Friday’s session alone producing a range of $4,478 to $4,738.
Silver has fared even worse. The white metal is down 13.21% on the week at $69.66/oz and has lost nearly a fifth of its value over the past month. Platinum and palladium have also been caught in the downdraft, falling 5.70% and 8.79% respectively on the week. This is a broad precious metals liquidation, not a gold-specific story.
Who’s involved
The selling pressure appears to be driven by leveraged positions unwinding rather than a fundamental reassessment of gold’s long-term thesis. When gold ran from sub-$4,000 to above $5,400 in a compressed timeframe, speculative length built up aggressively in futures markets. Moves of this magnitude tend to trigger margin calls that cascade through the complex.
Central banks - the dominant structural buyers of the past two years - are unlikely to be selling into this weakness. Their accumulation programmes operate on multi-year horizons and are largely insensitive to short-term price swings. The more probable sellers are momentum-driven funds and leveraged ETF holders who rode the rally and are now being forced out.
Retail demand is a mixed picture. Physical premiums in Asian markets have reportedly compressed, suggesting some bargain hunting, but Western ETF flows have turned negative as sentiment sours.
Why it matters
Gold’s reputation as an unconditional safe haven is being tested in real time. During the 2008 financial crisis, gold initially sold off alongside everything else before rallying sharply - a pattern that may be repeating here. Liquidity crunches do not discriminate; when margin calls hit, traders sell what they can, not what they want to.
The 2011 parallel is instructive. Gold peaked near $1,920 in September of that year and then dropped roughly 20% over the following weeks, even as the eurozone crisis intensified. It took nearly three years to find a durable bottom. The difference now is that central bank demand provides a structural floor that did not exist in 2011, and real interest rates - while rising - remain far less punitive in inflation-adjusted terms.
Silver’s underperformance is worth noting. The gold/silver ratio at 65.7 has actually compressed from where it sat during the rally, suggesting silver’s industrial demand component is dragging it lower as recession fears build. When silver leads to the downside, it typically signals that the selloff has a macro growth dimension beyond pure positioning.
What to watch
Fed Chair Powell’s speech today is the immediate catalyst. Any hint that the Fed views current market stress as sufficient to pause or reverse tightening could provide a sharp relief rally. Conversely, hawkish rhetoric would likely push gold towards the $4,478 intraday low tested on Friday.
Beyond Powell, three things matter in the coming week. First, whether gold can hold the $4,450-$4,500 zone - a level that represented resistance on the way up and should now act as support. Second, the pace of ETF outflows; a stabilisation here would suggest the forced selling is exhausting itself. Third, the gold/silver ratio - if it spikes above 70, it would signal a deeper risk-off move that could paradoxically become bullish for gold as flight-to-quality demand eventually reasserts itself.
The question is not whether this selloff creates opportunity - it almost certainly does - but whether the forced liquidation has run its course.
This article is for informational purposes only and does not constitute financial advice. Always do your own research before making investment decisions.