Silver in March 2026 fell 15.9%. That is a factual statement, and it is also, by itself, misleading.
The metal opened at $89.31 and closed at $75.14. It touched $69.75 on March 24 — a level that would have been the stuff of fantasy just six months ago when it was trading at $30, and that now feels like a crash. Both readings are correct. Silver’s problem is not that it fell. Silver’s problem is that it fell for reasons that are genuinely ambiguous, and the two sides of the bull-bear debate have never been further apart.
The bears see a metal that peaked at $121 in January, has now lost 38% from that peak, and faces accelerating industrial substitution at precisely the prices the bulls need to maintain their thesis. The bulls see a metal in its sixth consecutive year of supply deficit, with COMEX vaults draining at record pace and Chinese export restrictions still in force.
Both are right. This report tries to hold both truths simultaneously.
What happened
Price action
| Metric | March 2026 | vs. Prior Month | vs. Prior Year |
|---|---|---|---|
| Open (Mar 1) | $89.31 | - | - |
| Monthly High | $89.31 (Mar 1) | - | - |
| Monthly Low | $69.75 (Mar 24) | - | - |
| Close (Mar 31) | $75.14 | −15.9% | +112% |
| Average Price | ~$79 | - | - |
Silver’s decline was relentless rather than explosive. Unlike February’s twin crashes — each driven by specific margin-call cascading events — March was a slow bleed. Prices drifted lower through the first two weeks as oil steadily rose, accelerated downward in the week of March 17–24 as rate-cut expectations collapsed, and then stabilised near $75 as buyers emerged.
The pattern mirrors gold (which fell 12.2%) but with the amplification that silver always delivers. Silver fell harder, as it always does. The gold-silver ratio widened from approximately 57:1 at the start of the month to 64:1 by early April. That 7-point ratio expansion in a single month tells the story: silver carried more speculative leverage, more industrial sensitivity, and more volatility than gold into the month, and all three worked against it.
The drivers (in order of impact)
1. Oil-driven inflation killed rate cuts. The same mechanism that hit gold hit silver harder. Oil above $100/barrel pushed inflation expectations higher, the Fed shelved rate cuts at the March 17–18 FOMC meeting, and the 10-year Treasury yield climbed toward 4.5%. Silver is a zero-yield asset competing against bonds paying 4.5%. When rates were heading down, silver won that competition. When rates stopped heading down, it lost.
2. The dollar surged. DXY broke above 100 in mid-March — a headwind for all dollar-denominated commodities, but particularly for silver, whose smaller market makes it more sensitive to currency moves.
3. Western institutional investors sold. SLV experienced over $3.6 billion in outflows during Q1, with the heaviest selling in March. Three consecutive weeks of outflows — $835 million and $713 million in the final two reported weeks — broke the buying momentum that had characterised late 2025 and January 2026. The nine-month streak of precious metals ETF inflows ended.
4. Industrial demand softened. China’s manufacturing PMIs remained in contraction territory through March. Europe’s industrial output weakened further. The Iran-driven energy shock raised input costs for every manufacturer that uses silver, creating the perverse dynamic where the metal’s industrial consumers face both higher silver costs and higher energy costs simultaneously. This is the environment where thrifting accelerates fastest.
The ratio: expanding again
| Date | Gold | Silver | Ratio |
|---|---|---|---|
| January 29 (peak) | $5,594 | $121 | 46:1 |
| February 28 (close) | $5,274 | ~$93 | 57:1 |
| March 31 (close) | $4,670 | $75 | 62:1 |
| April 9 (current) | ~$4,729 | ~$74 | 64:1 |
The ratio has now expanded from a compressed 46:1 at the January peak to 64:1. That is still below the five-year average of approximately 80:1, which silver bulls correctly identify as evidence of continued relative cheapness.
But the direction matters more than the level. A ratio that compressed from 80 to 46 and is now re-expanding toward 64 is telling a specific story: the speculative positioning that drove the compression has been unwound, and silver is reverting toward its long-run relationship with gold. Whether it stops at 65 or continues to 80+ depends on whether the physical market can hold the line that the paper market is retreating from.
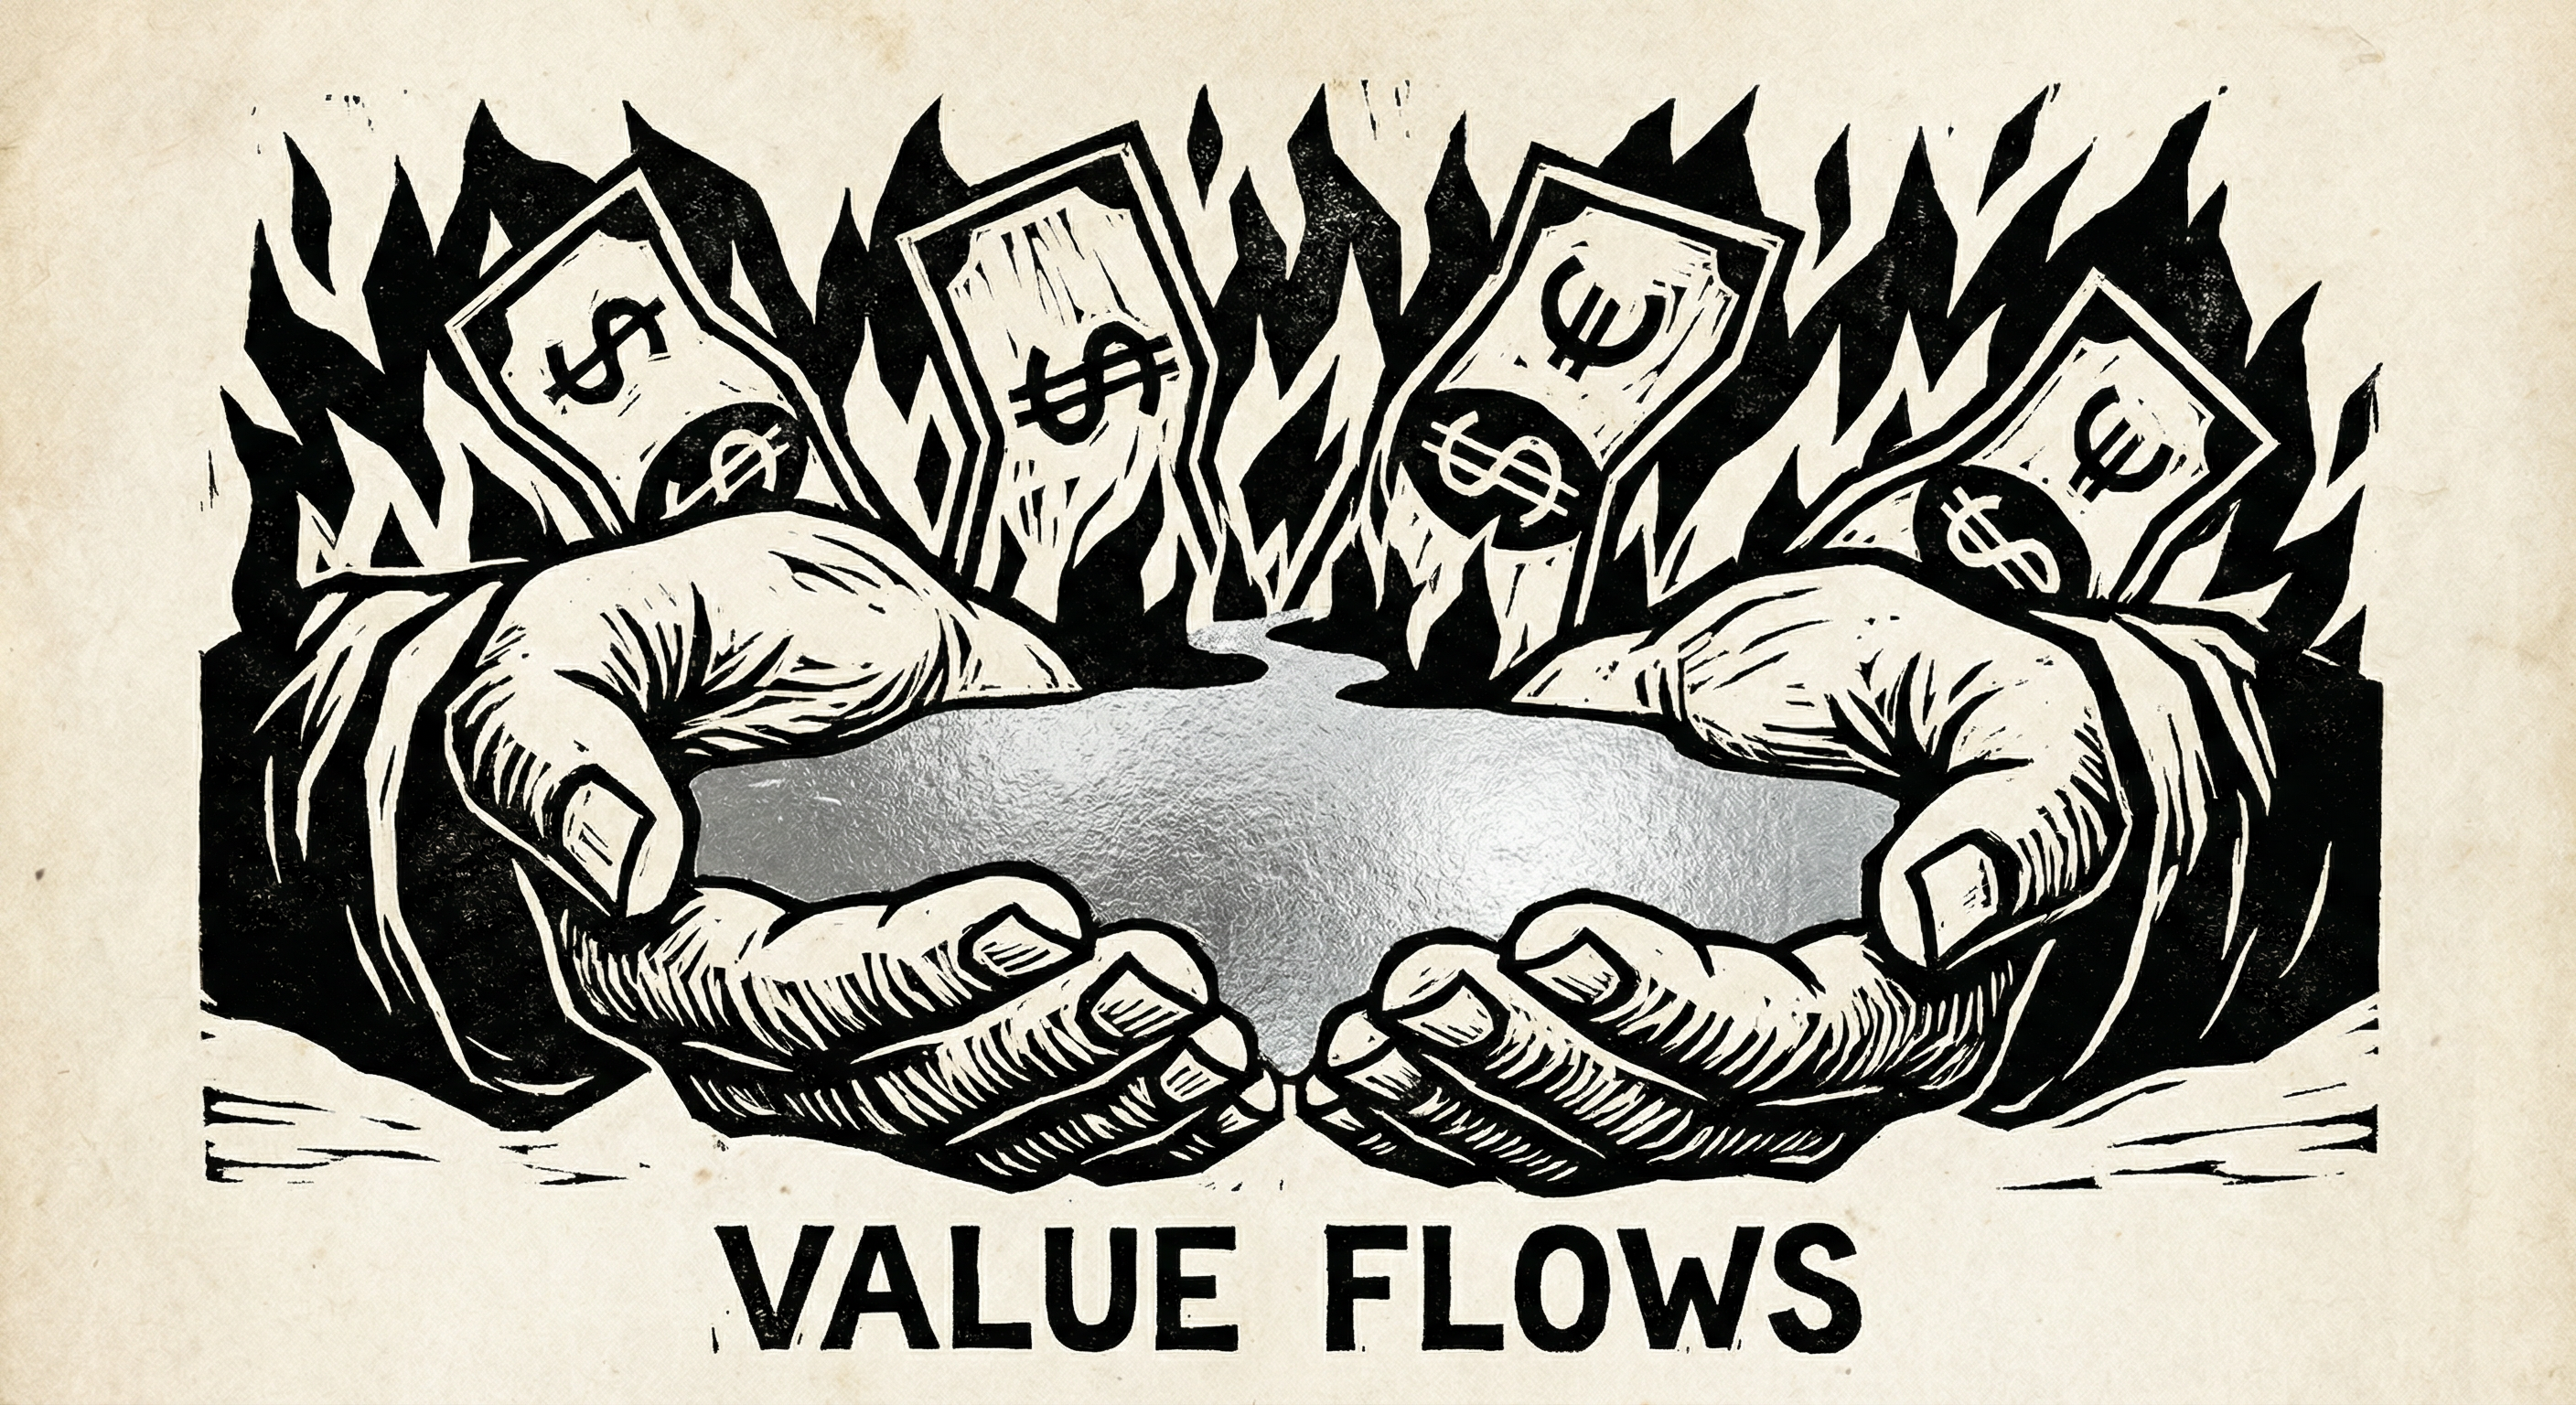
The physical vs paper disconnect
This is the most important section of this report.
Paper market: selling
The futures and ETF markets were in full retreat in March:
- SLV: Over $835 million in outflows in a single week (week ending March 21)
- COMEX managed money: Net long positions contracted sharply from January’s extreme readings
- Indian silver ETFs: Saw their first net outflows in 26 months — ending a record-breaking inflow streak
The message from paper markets is clear: investors who bought the rally are taking profits, reducing exposure, and reallocating to assets that benefit from higher rates (Treasuries, money market funds).
Physical market: buying
The physical market tells a completely different story:
- COMEX registered inventory: Fell to approximately 86 million ounces — down 75% from its 2020 peak. In January and February alone, 74.38 million ounces were delivered through COMEX, representing over 86% of the registered inventory available at the time
- Lease rates: Remained elevated throughout March, confirming genuine tightness in the London lending market
- Dealer premiums: Physical silver premiums at UK dealers (BullionByPost, Atkinsons, Chards) remained firm through the selloff — dealers did not cut premiums to match the falling spot price, which means the effective cost of physical silver fell less than the futures price suggested
- Direct offtake agreements: Industrial consumers are increasingly bypassing exchanges entirely, securing supply directly from miners. This removes physical metal from the price discovery mechanism
The disconnect is structural, not temporary. Paper markets price expectations about the future. Physical markets price today’s availability. When paper sells and physical doesn’t, the implication is that the selling is driven by financial positioning, not by a change in underlying supply and demand.
This does not mean the selloff was wrong. It means the selloff was about something different from what the physical market is pricing. Both can be true simultaneously.
Thrifting update: now undeniable
In January we called thrifting a threat. In February we called it confirmed. In March, it accelerated.
What changed
Silver now represents approximately 30% of total photovoltaic module costs — up from roughly 10% three years ago. At $75/oz, a standard solar panel uses approximately $12–15 of silver. At the January peak of $121, that figure approached $25. For an industry that competes on cents-per-watt economics, this is existential.
The response has been swift:
- Silver paste reduction: Leading cell manufacturers have reduced silver loading per cell from approximately 100mg to 70mg over the past 18 months. Further reduction to 50mg is targeted by 2027
- Copper-plated cells: Several Chinese manufacturers are now producing copper-plated heterojunction cells at pilot scale. If these achieve commercial viability, silver demand per cell falls by 80–90%
- R&D spending: Every major solar manufacturer has expanded silver-substitution R&D budgets materially since prices broke $100
The Silver Institute’s view
The Silver Institute’s February forecast (the most recent available) projected industrial fabrication demand to fall 2% in 2026 to a four-year low of 650 million ounces. This is the first year-over-year decline in industrial silver demand since 2020.
Why it matters but isn’t fatal
The 2% decline in fabrication demand is real and directionally significant. But it needs context:
- The deficit persists regardless. Even with a 2% demand decline, silver remains in a structural supply deficit of approximately 67 million ounces for 2026. The sixth consecutive year. Thrifting is reducing demand growth, not eliminating the shortfall
- Substitution timelines are measured in years, not months. Copper-plated cells are at pilot scale, not commercial production. Moving from pilot to mass manufacture typically takes 3–5 years in the solar industry
- New demand sources are emerging. AI data centres, advanced electronics, and medical applications are creating silver demand that partially offsets solar thrifting. These applications are less price-sensitive than solar
The honest assessment: thrifting is the most credible bear argument against silver. It is not yet large enough to close the structural deficit. Whether it becomes so depends on timelines that nobody can reliably predict.
Supply: still constrained
Mine production
Global silver mine production remains constrained at approximately 830 million ounces annually. Primary silver mining accounts for only about 28% of total production — the rest comes as a byproduct of lead, zinc, copper, and gold mining. This means silver supply cannot respond quickly to price signals in the way that, say, oil production can.
AISC for primary silver producers has risen to approximately $15–18/oz — still well below current prices but climbing. The oil shock adds an energy cost headwind: diesel and power account for a significant share of mining operating costs.
China export restrictions
China’s export licensing restrictions, implemented January 1, 2026, remain fully in force. Exports are limited to 44 state-sanctioned firms. China controls approximately 60–70% of global silver refining capacity and needs the silver for its own solar and EV production.
There has been no softening, no exemptions, and no indication of policy change. This remains the single most important supply-side variable for Western silver markets.
COMEX vault dynamics
The numbers bear repeating: COMEX registered silver inventory has fallen to approximately 86 million ounces — down 75% from its 2020 peak. In the first two months of 2026 alone, 74.38 million ounces were stood for delivery.
These are not abstract statistics. They represent physical metal being removed from exchange-accessible inventory at a pace that cannot continue indefinitely. If delivery demand continues at this rate while registered inventory continues declining, the exchange faces a practical supply constraint that no amount of paper selling can resolve.
Recycling
The Silver Institute forecasts scrap recycling will rise 7% in 2026 to over 200 million ounces — the highest since 2012. End-of-life solar panel recycling is now a measurable (if still small) supply source. At current prices, scrap economics are attractive — but recycling operates on longer timescales and cannot offset the pace of inventory decline.
How to navigate silver in this environment
The practical guidance for UK investors has not changed structurally from February, but the price context has shifted enough to warrant an update.
UK-listed silver ETCs
At $75/oz, the VAT hurdle on physical silver is slightly less punitive than at $93 but still material — 20% VAT means silver needs to rise roughly 25% just to break even on a physical purchase. UK-listed silver ETCs are not subject to that VAT and offer exchange-traded liquidity. They are controlled investments under FSMA — see the factual silver ETC reference page for the current set of products with tickers, TERs and vault arrangements. The 2025/26 ISA window closed on 5 April; the 2026/27 allowance has refreshed at £20,000.
Suitability of any specific product, wrapper or allocation is a personal question for a regulated adviser.
Physical silver
Silver Britannias remain the only sensible physical option for UK buyers due to their CGT exemption. At $75/oz silver (~£58/oz at current exchange rates), premiums of 30–40% over spot mean an effective acquisition cost of £75–81/oz. You need silver to rise substantially to recover that premium.
Mining equities
Silver mining equities offer leveraged exposure with company-specific risk:
- Fresnillo (FRES) — FTSE 100, primary silver producer, hedged exposure. Down approximately 18% from January highs but still up substantially year-on-year
- Pan American Silver (PAAS) — Record $3.62 billion in 2025 revenue, $1.3 billion in cash. 2026 guidance: 25–27 million oz silver. The strongest balance sheet in the sector
- First Majestic (AG) — Pure-play silver with Mexico political risk
- Wheaton Precious Metals (WPM) — Streaming model, lower operational risk
At current silver prices, primary producers remain highly profitable. PAAS at $75 silver is generating margins that would have been inconceivable two years ago. The equities have corrected less than the metal — a sign that the market views the correction as temporary.
Risk factors
Near-term (April)
- Ceasefire collapse: If the US-Iran ceasefire fails, oil returns above $100, energy costs rise further, and silver faces the double headwind of macro-driven selling and industrial demand destruction
- Ratio re-expansion to 80:1: If the ratio continues expanding from 64 toward its long-run average of 80, that implies silver at ~$59 even if gold holds $4,700. This is a plausible bear scenario
- Fed minutes and CPI data: Any evidence that rate hikes are under serious discussion would be acutely negative for silver
Structural
- Thrifting acceleration: If copper-plated solar cells reach commercial viability faster than expected, the demand thesis requires fundamental re-evaluation
- COMEX inventory exhaustion: If registered inventory continues declining at current pace, the exchange may need to intervene with position limits or delivery restrictions — creating short-term chaos but potentially forcing a physical repricing
- China policy reversal: Any relaxation of export restrictions would significantly increase Western supply — though current geopolitical tensions make this unlikely
April outlook
What the ceasefire means for silver
The April 7 US-Iran ceasefire, if it holds, is unambiguously positive for silver:
- Oil falls → inflation expectations ease → rate cuts return to the table → silver benefits from lower opportunity cost
- Energy costs for manufacturers decline → slows the urgency of thrifting → preserves more industrial demand
- Risk appetite improves → capital rotates back into commodities and growth-sensitive assets → silver benefits as a “high-beta precious metal”
If the ceasefire fails, the picture is more complex. Silver benefits from the safe-haven bid (modest) but is hurt by higher energy costs (significant for industrial demand) and delayed rate cuts (significant for investment demand). The net effect of ceasefire failure is probably modestly negative for silver — the opposite of gold, which benefits more cleanly from geopolitical chaos.
What could change the picture
Silver’s volatility makes precise targets unreliable, and March proved the point. Three rough scenarios are worth describing as conditions to watch:
- Ceasefire holds — oil normalises, one rate cut returns to pricing by September, and industrial demand stabilises. The mechanical pressure on silver from energy costs eases.
- Swift resolution — geopolitical de-escalation paired with resumed ETF inflows. COMEX inventory tightness becomes more visible as the macro backdrop calms.
- Ceasefire fails — oil above $100 through Q2, thrifting accelerates, and the gold-silver ratio widens further. Multiple cyclical pressures reassert at once.
Third-party institutional desks have published a range of numerical 2026 views: J.P. Morgan around $81/oz, Deutsche Bank around $100/oz, UBS around $85/oz, BNP Paribas a $65–75 range. These are useful to cite as external opinion; they should not be read as our own targets.
Where the structural picture sits
The structural case has not weakened. The deficit persists, China’s restrictions hold, and COMEX inventory remains at multi-decade lows. The tactical picture has genuinely deteriorated, though, on four counts:
- Thrifting is confirmed and accelerating. A 2% decline in industrial fabrication is not trivial. It does not destroy the structural deficit narrative, but it removes the assumption of indefinitely rising demand.
- The ETF flow has reversed. Western institutional money, which powered the 2025 rally, is now flowing out. The metal lacks its primary marginal buyer for now.
- The ratio is expanding. Silver is underperforming gold on a relative basis, which typically signals that the speculative positioning compressing the ratio is being unwound.
- Energy costs complicate everything. Silver’s dual nature — part precious metal, part industrial commodity — means the Iran conflict creates offsetting forces rather than the clean tailwind gold enjoys.
Whether those tactical conditions reverse depends on the ceasefire, the path of COMEX physical inventory, and Western ETF flow direction. Anyone making position decisions on this should consult a regulated adviser.
What to watch
- Iran ceasefire (April 21 expiry): Extension or collapse determines whether the energy headwind fades or intensifies. This is silver’s most important near-term variable
- April ETF flow data: Whether the $3.6 billion Q1 SLV outflow reverses or accelerates
- COMEX registered inventory updates: If inventory falls below 80 million ounces, the physical tightness story intensifies materially
- Gold-silver ratio direction: A stabilisation near 64 or compression back toward 58–60 would historically have been associated with silver outperformance; expansion toward 70+ would be consistent with the relative-weakness pattern that defined March
- Solar industry thrifting data: Any announcements of commercial-scale copper-plated cell production would be structurally negative
- China export policy: Any softening of restrictions (unlikely but high-impact)
Conclusion
March was the month where silver’s two personalities — precious metal and industrial commodity — pulled in opposite directions.
As a precious metal, silver should have benefited from geopolitical crisis. It did, briefly, at the start of the month. But the nature of the crisis — an energy shock that raises inflation and delays rate cuts — overwhelmed the safe-haven bid.
As an industrial commodity, silver faced the worst possible environment: higher energy costs for its consumers, an accelerating push to use less of it, and softening manufacturing activity globally.
The result was a 15.9% decline and the tenth consecutive month of range we would characterise as “extraordinary by any normal standard but increasingly routine for silver in 2026.”
The structural case — supply deficit, COMEX drawdowns, China restrictions, critical mineral status — has not changed. These are multi-year forces that a single month of selling cannot alter. The tactical case, however, has weakened: until the ceasefire picture clarifies and the ETF flow reversal materialises, the structural drivers will not necessarily express themselves in price.
What can be said factually: silver at $75 is a fundamentally different proposition from silver at $121. The structural floor provided by the deficit and physical tightness makes the risk of a sustained decline well below $65 less acute than the headline drawdown might suggest. The ceiling depends on factors — ceasefire durability, rate-cut timing, thrifting pace — that remain genuinely uncertain.
What this report deliberately does not do is tell any particular reader whether to hold, buy, or sell silver in any specific form. The next move could be $60 or $100 with roughly equal probability on the public information available. Anyone making a position decision on the back of that should be talking to a regulated financial adviser who knows their circumstances; that is not us.
This is the March 2026 edition of MetalsAlpha: State of Silver. The US-Iran ceasefire remains fragile as of April 9, 2026. Past performance does not guarantee future results. This is not financial advice — we are investors sharing what we have found.