On this page
Gold at $5,234 - But Where Does It End the Decade?
With gold already up over 3% this month and trading above $5,200, the real question isn’t whether the bull run continues - it’s how much further Wall Street thinks it can go before 2030.
What to know
-
Gold is trading at $5,234/oz as of February 27, 2026, up 3.04% month-over-month with an intraday range of $5,183–$5,259.
-
Bernstein has updated its end-of-decade gold price forecast, adding to a growing chorus of institutional projections that have repeatedly underestimated the metal’s trajectory.
-
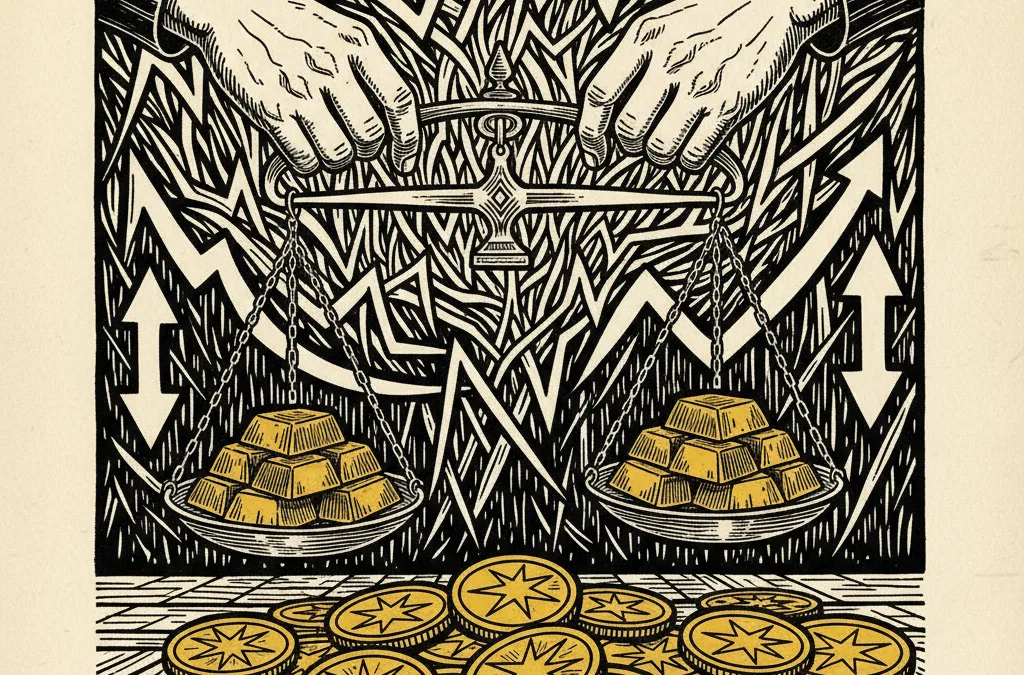
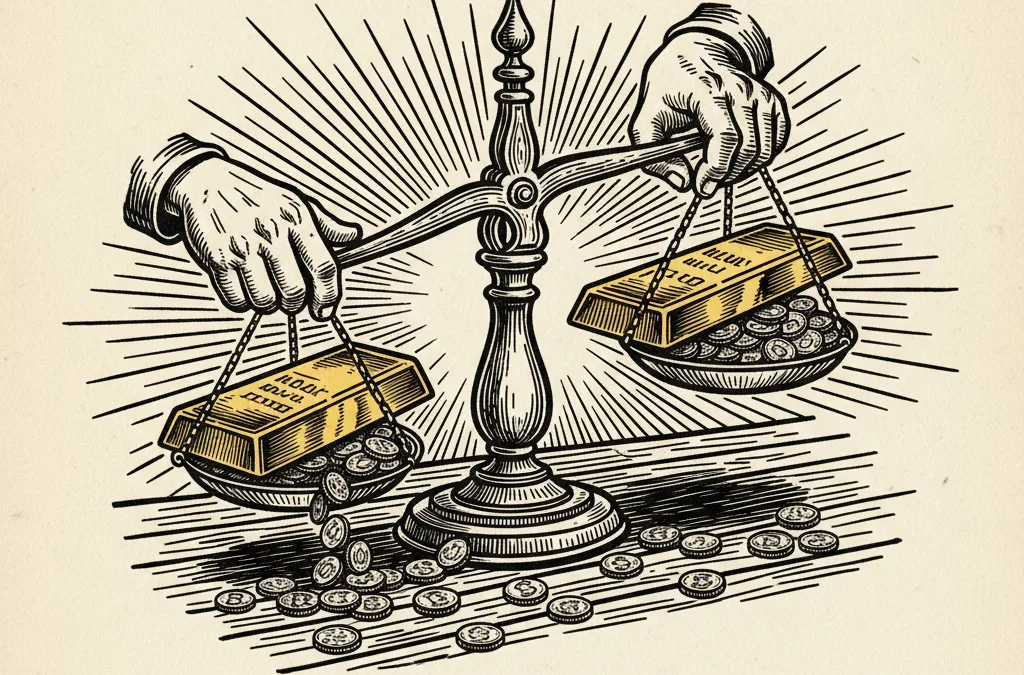
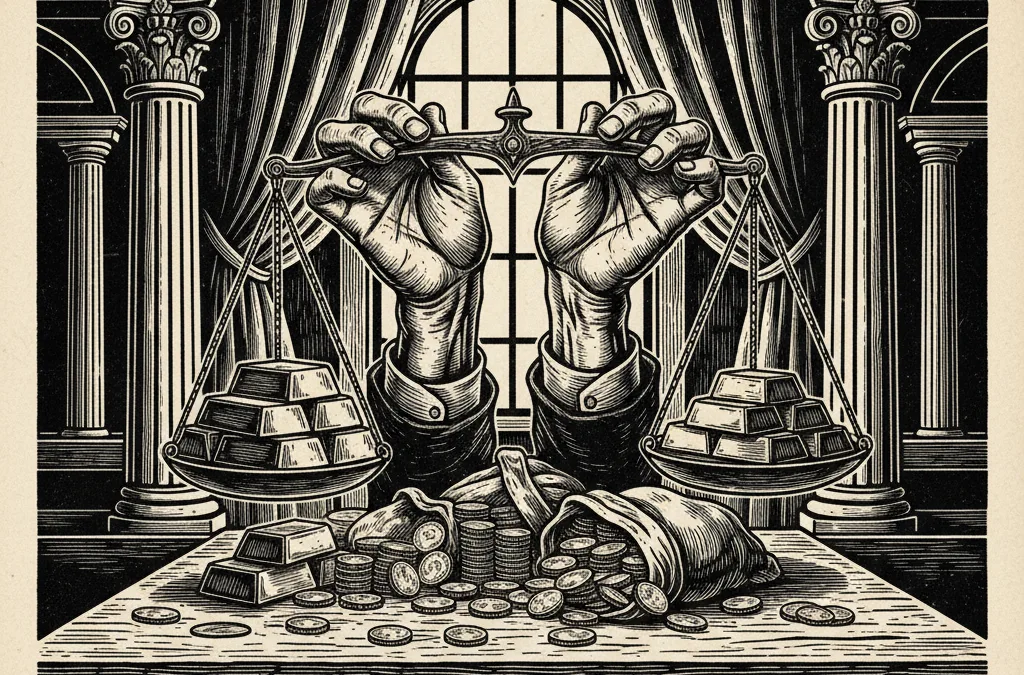
The gold/silver ratio sits at 56.5, well below its historical average, suggesting broad precious metals strength rather than a gold-only phenomenon.
What happened
Bernstein has refreshed its gold price forecast through the end of the decade. Gold is currently at $5,234/oz, up 3% in February alone, with the monthly trading range stretching from $4,400 to $5,586 - a $1,186 band.
Institutional price targets for gold have been in constant revision since the metal blew through $3,000, then $4,000, and now trades above $5,000. Every major bank that anchored forecasts to pre-2024 assumptions has been forced to recalibrate. Bernstein’s timing matters because it reflects how quickly consensus is shifting - the old ceiling becomes the new floor.
Who’s involved
Bernstein joins Goldman Sachs, JPMorgan, and UBS in ratcheting targets higher over the past 18 months, each revision chasing a market that refuses to slow down.
Central banks remain the dominant force on the demand side. Sovereign buying - particularly from China, India, Poland, and several Middle Eastern nations - has structurally altered the supply-demand equation. Western ETF flows have reaccelerated after a prolonged period of outflows in 2023–2024, adding a second demand pillar.
On the supply side, major miners like Newmont, Barrick, and Agnico Eagle are generating record free cash flow at these prices, but new production growth remains constrained by permitting timelines and declining ore grades. The supply response cannot keep pace.
Why it matters
When a firm like Bernstein moves its decade-end target, it signals that the institutional framework for valuing gold has fundamentally changed. Gold averaged roughly $1,800 in 2022. It’s now nearly triple that level. The drivers - de-dollarization, U.S. fiscal deficits exceeding 6% of GDP, and persistent geopolitical fragmentation - show no signs of reversing.
European inflation data due today from France and Germany could reinforce the macro case. Sticky eurozone CPI readings tend to support gold as a real-asset hedge, even as they complicate ECB rate decisions.
The gold/silver ratio at 56.5 is also telling. Silver’s 7% weekly surge to $92.59 suggests this isn’t a narrow, fear-driven gold bid - it’s a broad precious metals repricing. Platinum’s 11.2% weekly jump to $2,387 reinforces the same theme.
What to watch
Three levels matter from here. First, the $5,586 monthly high - that’s the level gold needs to clear convincingly to open the path toward $5,800 and beyond. A failure there could trigger a pullback toward $5,000, which would represent healthy consolidation rather than a trend reversal.
Second, today’s European inflation prints. If French and German CPI come in hot, expect renewed safe-haven flows into gold and further pressure on the ECB’s easing timeline.
Third, watch how quickly banks revise forecasts upward. At $5,234, gold is expensive by any historical standard, but the structural bid appears intact. Whether the forces driving this rally have an expiration date remains the open question - and so far, there’s no clear answer.
This article is for informational purposes only and does not constitute financial advice. Always do your own research before making investment decisions.
Sources & Data
- European Central Bank - ECB speeches and policy statements
- Federal Reserve - FOMC policy decisions
- ONS - ONS Consumer Price Index data