On this page
Gold touched $5,600/oz at the end of January. It has since settled back to around $5,200. The question most people have - whether they hold gold or are thinking about it - is straightforward enough: has the rally run its course, or is there more to come?
No clean answer exists, but there are ways to frame it. We looked at nine indicators across price, time, valuation, participation, and macro context to see what they suggest.
How long has this been going?
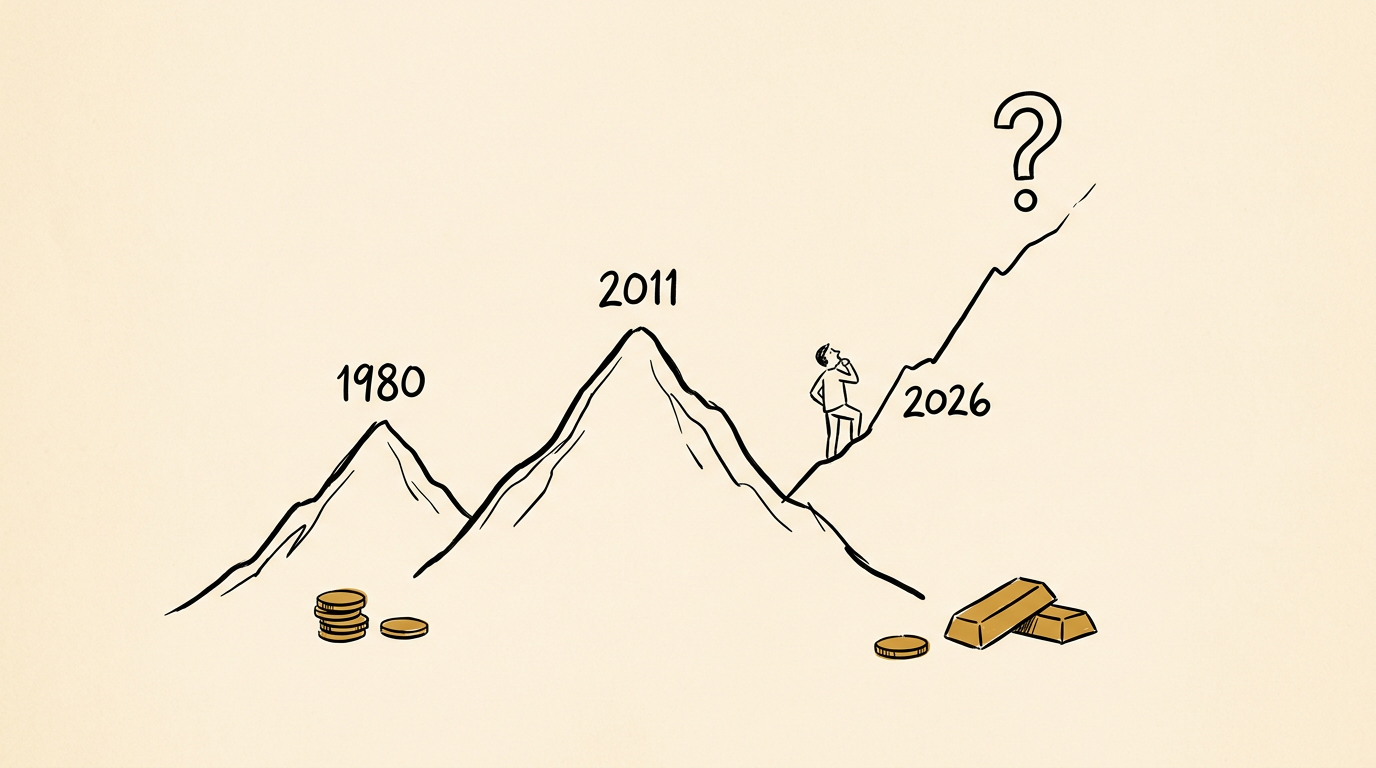
There have been two major gold bull markets since the end of the gold standard: 1971-1980 and 2001-2011. Each ran for roughly nine to ten years.
Where you date the start of the current one depends on what you count. The bear market low of $1,045 came in late 2015. There was a retest at $1,160 in 2018. Gold broke out of its multi-year base in 2019. You could even argue the real acceleration began in late 2022.
If you start in 2015, the cycle is already ten years old - matching the duration of previous ones. Start in 2018 or 2019, and there may be several years left. It is genuinely hard to pin down, and anyone who tells you otherwise is probably selling something.
Signal: mid- to late-cycle.
Gold versus everything else
Relative valuations tell you more than the dollar price alone.
| Ratio | Current | Historical range | Read |
|---|---|---|---|
| Gold / oil (barrels per oz) | ~60 | 6 - 30 | Extreme - though arguably oil is cheap, not gold expensive |
| Gold / S&P 500 (oz per unit) | ~1.3 | 0.2 - 5.0 | Gold pricey vs equities, but not at historic extremes |
| Gold / US housing (oz per home) | Approaching 1980 levels | Varies widely | Warning territory |
The gold/oil ratio is at levels only seen during the 2020 pandemic collapse. Some of that is structural - commodities tend to get cheaper in real terms as extraction improves. Still, it is an outlier.
Against equities, gold is on the expensive side. Against housing, it is approaching levels last seen at the 1980 peak. That one stands out.
Signal: late-cycle. Worth paying attention to.
Who owns it?
Gold remains a small fraction of global institutional portfolios relative to equities and bonds. Mining equities are even more neglected. Retail demand hit record levels for bars and coins in 2025, and ETF inflows are rising - but they are not yet at the kind of frenzy that marks a top. Silver went briefly manic in February, then unwound.
If this were late-cycle, you would expect to see gold as a mainstream portfolio allocation and mining stocks at elevated valuations. Neither is the case.
Signal: mid-cycle.
Central banks
Central bank buying slowed to 863 tonnes in 2025, according to the World Gold Council - down from record levels in 2024 but still well above the 2010-2021 average. January figures showed just 5 tonnes of net purchases, below the monthly average of 27 tonnes, though late reporting from the People’s Bank of China and others makes this unreliable as a real-time indicator.
The conventional view is that central bank accumulation is an early- or mid-cycle phenomenon. That might not hold this time. If the underlying driver is de-dollarisation and reserve diversification - and the geopolitical backdrop suggests it is - then official buying could continue for years.
Gold currently represents just under 30% of central bank reserves globally. The US dollar still accounts for roughly 56%. One argument is that this bull market does not end until gold’s share overtakes the dollar’s. We do not know whether that is right, but it is a framework worth holding in mind.
Signal: mid-cycle.
Leverage and speculation
Leverage is difficult to measure across all channels - futures positioning, options, junior mining flows, retail spread betting. Gold is a well-attended trade, but it is not a mania.
One useful test: when the geopolitical shock in Iran arrived last week, gold held up. A truly leveraged, fragile market would have sold off sharply as positions were unwound. It did not.
Signal: mid-cycle.
Mining equities
Miners had a strong 2025. Reports from PDAC - the world’s largest mining conference - suggest the energy last week was reminiscent of 2011, which is a cautionary datapoint.
On a relative basis, though, the ratio of large mining companies (the XAU index) to the gold price sits at historically depressed levels after a nine-year base. Miners would need to rally substantially to return to valuations seen in the early 2000s. Whether the ETF era has permanently compressed that ratio is an open question - gold ETFs made it possible to own the metal without company-specific risk, and that structural shift may not reverse.
Typically, the end of a gold bull market brings an exploration IPO boom, M&A frenzy, and parabolic moves in junior miners. We are seeing activity, but not that.
Signal: mid-cycle.
The narrative
Gold is appearing in the Financial Times and The Economist with more regularity. But the story is still far from mainstream. Most people could not tell you what the LBMA does or why central banks are accumulating gold.
Some familiar late-cycle narratives are surfacing, though. The calculation that settling US national debt (~$39 trillion) against America’s 262 million ounces of gold would require a price of roughly $150,000 per ounce - that kind of arithmetic tends to appear closer to tops than bottoms. When those numbers migrate from niche newsletters to social media, that is when you pay attention. We are not there yet.
Silver remonetisation talk is another one. Silver has genuine industrial demand (solar, electronics) and may well overshoot. But its historical monetary role - as a medium of exchange - is not coming back in a world where transactions are digital. Gold’s role as a store of value is structurally different. (We compare the two metals in more detail in our silver vs gold guide.)
Signal: mid-cycle.
Real yields - the one that matters most
Gold bull markets have ended when real interest rates rise sharply. Volcker’s rate hikes killed the 1970s rally. The shift from deeply negative to positive real yields ended the 2011 cycle within months. (For more on how gold responds to inflation and rate expectations, we have a separate guide.)
Today, nominal yields are relatively high, but inflation remains elevated and fiscal deficits are enormous. Real yields - the gap between nominal and inflation-adjusted returns - sit around zero or slightly positive. That is not restrictive enough to end a gold bull market.
The danger signal would be inflation falling sharply while nominal yields hold, pushing real yields above +2%. That is not where we are.
Signal: mid-cycle.
Adding it up
| Indicator | Signal |
|---|---|
| Duration | Mid- to late-cycle |
| Relative valuation | Late-cycle |
| Institutional ownership | Mid-cycle |
| Central banks | Mid-cycle |
| Retail participation | Mid-cycle |
| Leverage | Mid-cycle |
| Mining equities | Mid-cycle |
| Narrative | Mid-cycle |
| Real yields | Mid-cycle |
Seven of nine indicators point to mid-cycle. Two - duration and relative valuation - raise concerns. That does not make them wrong, but they are outnumbered.
Whether gold reaches $8,000 or $10,000 before this cycle ends is beyond our ability to forecast. What we can say is that the typical markers of a blow-off top - retail mania, extreme leverage, mainstream narrative saturation, sharply positive real yields - are not present.
The January spike to $5,600 may have been a local top. It may not. We do not know, and anyone claiming certainty about the trajectory of gold prices over the next three to five years is guessing - possibly well, possibly badly.
For UK investors specifically, the sterling dimension adds another layer. The pound has lost roughly 40% of its purchasing power since 2020, and the structural pressures behind that - fiscal deficits, institutional inertia, monetary accommodation - show no signs of reversing. Gold priced in sterling has outperformed gold priced in dollars for most of this cycle, and that gap is not closing.
This is not financial advice. It is one way of looking at the data.
Frequently asked questions
Has the gold bull market peaked?
Most indicators - including institutional ownership, central bank buying, leverage, mining equity valuations, and real yields - point to a mid-cycle environment rather than a late-cycle one. Duration and relative valuation against other assets are the main warning signals, but they are outnumbered.
How long do gold bull markets usually last?
The two major gold bull markets since the end of the gold standard (1971-1980 and 2001-2011) each lasted roughly nine to ten years. Depending on where you mark the start of this one, it could be seven to ten years old.
What would end the current gold bull market?
Historically, gold bull markets have ended when real interest rates rise sharply. The danger signal would be inflation falling while nominal yields stay high, pushing real yields well above +2%. That has not happened yet.
Are central banks still buying gold in 2026?
Central bank purchases totalled 863 tonnes in 2025 - down from record 2024 levels but still well above the 2010-2021 average. Gold represents roughly 30% of global central bank reserves, compared with 56% for the US dollar.