On this page
Gold Suffers Worst Weekly Plunge Since 2011
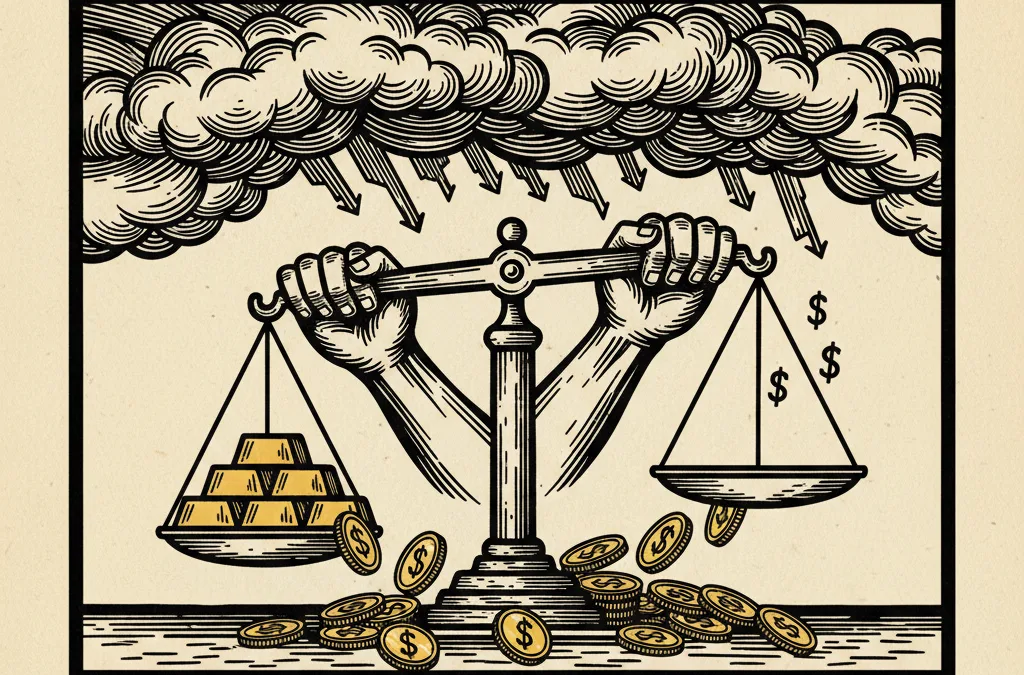
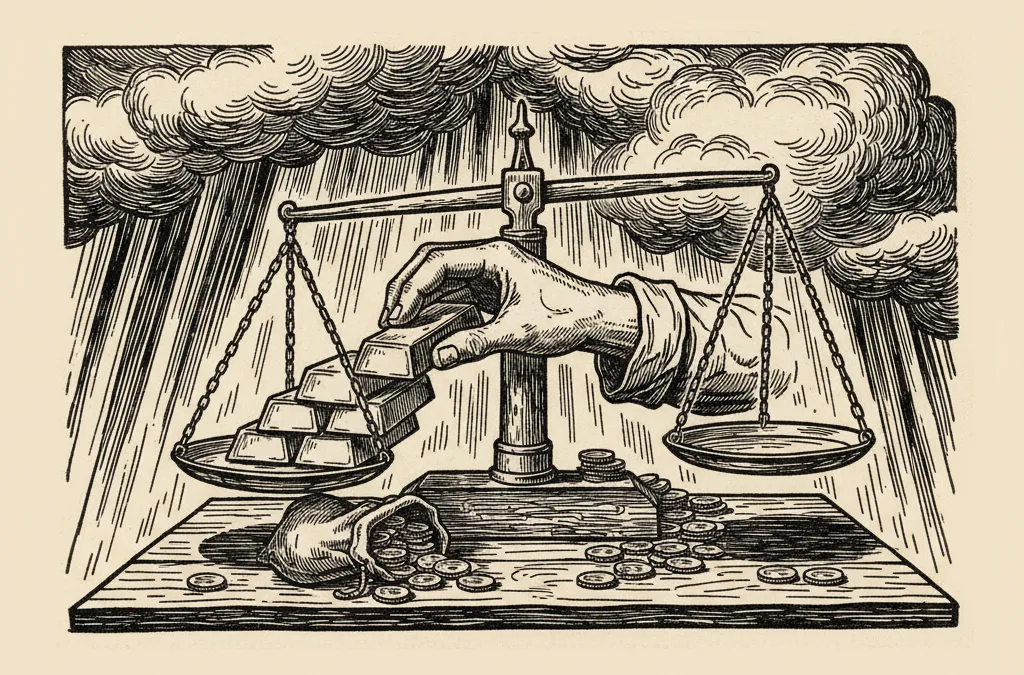
Gold has shed over 8% in a single week - its steepest drop in fifteen years - as a hawkish Federal Reserve and surging dollar dismantle the haven trade that carried bullion above $5,000 just weeks ago.
What to know
-
Gold fell 8.39% this week to $4,574.90/oz, its sharpest weekly decline since September 2011, after trading above $5,400 earlier this month.
-
Silver was hit even harder, dropping 13.21% on the week to $69.66/oz, with the gold/silver ratio compressing to 65.7.
-
The selloff was driven by a hawkish Fed stance and renewed US dollar strength, unwinding the safe-haven premium that had built up across precious metals.
What happened
Gold closed the week at $4,574.90/oz, down $419.10 or 8.39% - a magnitude of weekly loss not seen since the violent reversal in September 2011, when bullion cratered after its post-financial-crisis peak. The damage over a wider lens is even more stark: gold has shed $629.80 in the past month alone, a 12.10% drawdown from the $5,405 high printed earlier in March.
The broader precious metals complex followed gold lower, but with amplified pain. Silver collapsed 13.21% on the week to $69.66/oz, erasing nearly a fifth of its value over the past month. Platinum dropped 5.70% to $1,970.50, while palladium fell 8.79% to $1,445.20. No corner of the sector was spared.
The catalyst was clear: the Federal Reserve’s latest communications struck a decidedly hawkish tone, pushing back firmly against market expectations for near-term rate cuts. The resulting dollar strength pulled the rug from under a gold price that had been elevated on haven demand and speculative momentum.
Who’s involved
The Fed is the central actor. By maintaining a restrictive posture and signalling patience on easing, policymakers have re-anchored rate expectations higher for longer. This directly pressures non-yielding assets like gold, which must compete with real yields on Treasuries and dollar-denominated alternatives.
Momentum-driven and leveraged traders appear to have been caught badly offside. The speed of the decline - nearly $930 from peak to the monthly low of $4,478.40 - suggests forced liquidation and stop-loss cascading, particularly in the futures market. When gold was surging past $5,000, speculative long positioning had stretched to historically elevated levels. That crowding is now unwinding violently.
Central bank buyers, who have been consistent accumulators over the past three years, are likely watching from the sidelines at these velocity moves rather than stepping in to catch a falling knife. Physical demand from Asia - a key pillar of support during prior corrections - will be the variable to monitor in coming sessions.
Why it matters
A weekly drop of this magnitude forces a reassessment of the bull narrative. Gold’s rally above $5,000 was built on a confluence of geopolitical risk, central bank accumulation, and expectations of monetary easing. Two of those three pillars have cracked. If the Fed holds firm and the dollar sustains its bid, the haven premium that carried gold through the first quarter evaporates quickly.
The 2011 parallel is instructive but imperfect. Back then, gold’s peak marked the end of a multi-year post-crisis rally and preceded a grinding bear market that lasted until 2015. The structural backdrop today is different - sovereign debt levels are far higher, de-dollarisation flows are more entrenched, and central bank buying has been more systematic. The tactical message is the same: when the dollar reasserts itself and real rates rise, gold struggles regardless of the longer-term thesis.
Silver’s outsized decline is also telling. The gold/silver ratio at 65.7 has actually compressed from recent levels, meaning silver is underperforming on a relative basis - a classic risk-off signal within the metals complex. Silver’s industrial demand component makes it more vulnerable to growth concerns layered on top of the dollar headwind.
What comes next
The $4,478 monthly low is the immediate line in the sand. A breach would open the door to a deeper correction toward the $4,200-$4,300 zone, where buyers stepped in during January’s consolidation. Fed communications over the coming fortnight will be decisive. Any hint of a dovish pivot - or even softer language on the inflation outlook - could trigger a sharp snapback given how aggressively positioning has been flushed.
Physical premiums in Shanghai and Mumbai will show whether Asian buyers treat this as a buying opportunity or step back further. The dollar index and US 10-year real yields are the two charts that matter most for gold right now.
This article is for informational purposes only and does not constitute financial advice. Always do your own research before making investment decisions.