On this page

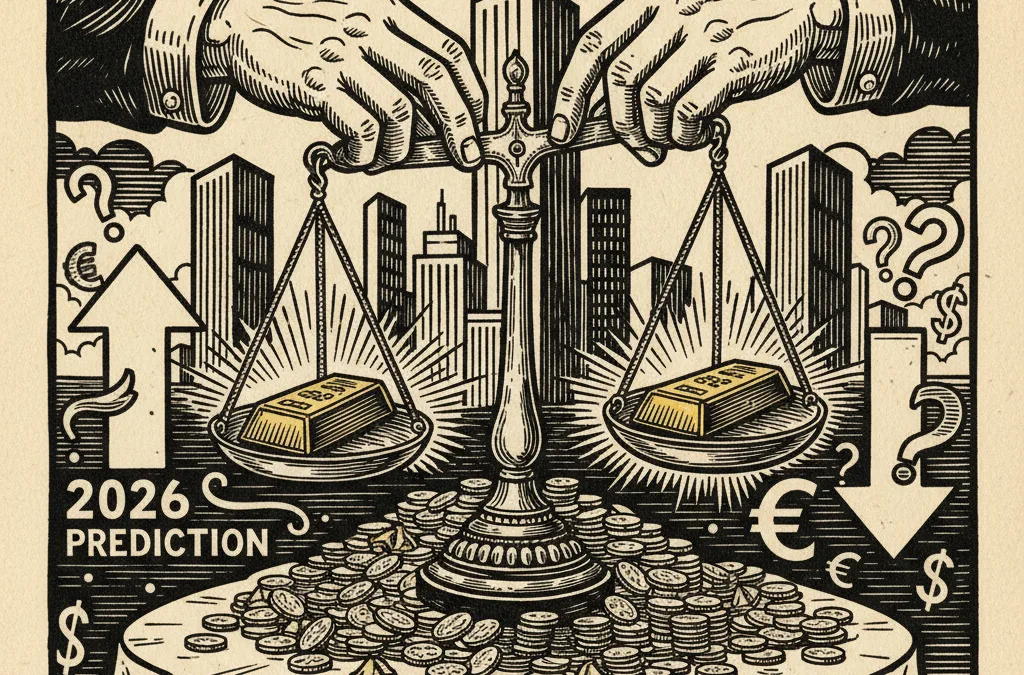
Gold at $4,700 - But Banks Can’t Agree Where It Goes Next
Major institutional forecasts for Q2 2026 are landing amid gold’s wildest monthly range in years, and the divergence in outlook tells its own story about how fractured the macro picture has become.
What to know
-
Gold is trading at $4,702.70/oz after a brutal month that saw a $1,203 swing between the $4,100 low and $5,303 high - a 29% intra-month range.
-
JP Morgan, ANZ, and HSBC are all publishing Q2 2026 outlooks, but the lack of consensus among major banks reflects genuine uncertainty about rate paths and geopolitical risk.
-
Today’s US nonfarm payrolls release could set the tone for gold’s next directional move, with labour market strength directly influencing Fed rate expectations.
What happened
Over the past month, gold has swung from a low of $4,100.80 to a high of $5,303.80, a spread of over $1,200 per ounce. That 29% intra-month range is the kind of volatility typically reserved for crisis periods, not consolidation phases. Gold now sits at $4,702.70/oz - awkwardly in the middle of that vicious range.
The weekly picture is more constructive - gold is up 3.9% over the past five sessions, clawing back ground after the sharp sell-off from its monthly peak. But the broader monthly decline of 7.92% underscores just how treacherous the environment remains for directional bets.
Q2 outlooks from JP Morgan, ANZ, and HSBC are hitting desks now. The timing matters. When three of the world’s most-watched precious metals research teams publish forecasts simultaneously, the degree of agreement - or disagreement - becomes a signal in itself.
Who’s involved
JP Morgan’s commodities desk has been among the more structurally bullish voices on gold over the past two years, consistently front-running consensus with higher targets. ANZ has taken a more measured approach, typically anchoring forecasts to central bank demand data and physical flows from Asia. HSBC has historically leaned conservative, often trailing the market’s actual moves.
The broader institutional landscape is similarly divided. Central bank buying - which drove much of gold’s ascent from $2,000 to $4,000 - remains a powerful tailwind, but the pace of purchases has shown signs of moderating. Meanwhile, ETF flows have been choppy, with Western investors alternating between conviction buying and profit-taking as gold repeatedly tests and fails to hold above $5,000.
Silver is tracking a similar pattern at $73.17/oz, down nearly 12% on the month but up 4% on the week. The gold-silver ratio at 64.3 suggests silver is holding relatively firm, though it remains far from the sub-50 levels that would signal genuine industrial-demand-driven outperformance.
Why it matters
The lack of consensus among major banks is itself the most useful data point. When forecasters cluster tightly around a number, the market tends to already be priced for that outcome. When they diverge, it signals genuine uncertainty about the macro trajectory - and that means opportunity for those willing to take a view.
Gold’s current positioning near $4,700 places it roughly in the middle of its recent range. The $5,300 high marked a moment of peak fear, likely driven by geopolitical escalation and dollar weakness. The $4,100 low reflected aggressive profit-taking and a brief resurgence in real yields. Neither extreme held, which suggests the market is still searching for a fundamental anchor.
Today’s US nonfarm payrolls data adds another layer of complexity. A strong labour print would bolster the case for the Fed holding rates steady - typically a headwind for non-yielding assets like gold. A weak number could reignite rate-cut expectations and push gold back toward the upper end of its range. Platinum at $1,999.90 and palladium at $1,515 - both up sharply on the week - hint that the broader metals complex is positioning for a softer economic backdrop.
What to watch
The payrolls number landing today is the immediate catalyst. Beyond that, three things matter. First, whether gold can sustain a close above $4,800 this week - a level that would confirm the recovery from the monthly low has legs. Second, the pace of central bank gold purchases in Q2 data, which will either validate or undermine the structural bull case. Third, the gold-silver ratio: a sustained move below 60 would suggest risk appetite is broadening across the metals complex, a historically bullish signal for the entire sector.
The bank forecasts will fill in over the coming days, but gold’s failure to hold either $5,300 or $4,100 suggests the next $500 move could come in either direction.
This article is for informational purposes only and does not constitute financial advice. Always do your own research before making investment decisions.