Executive summary
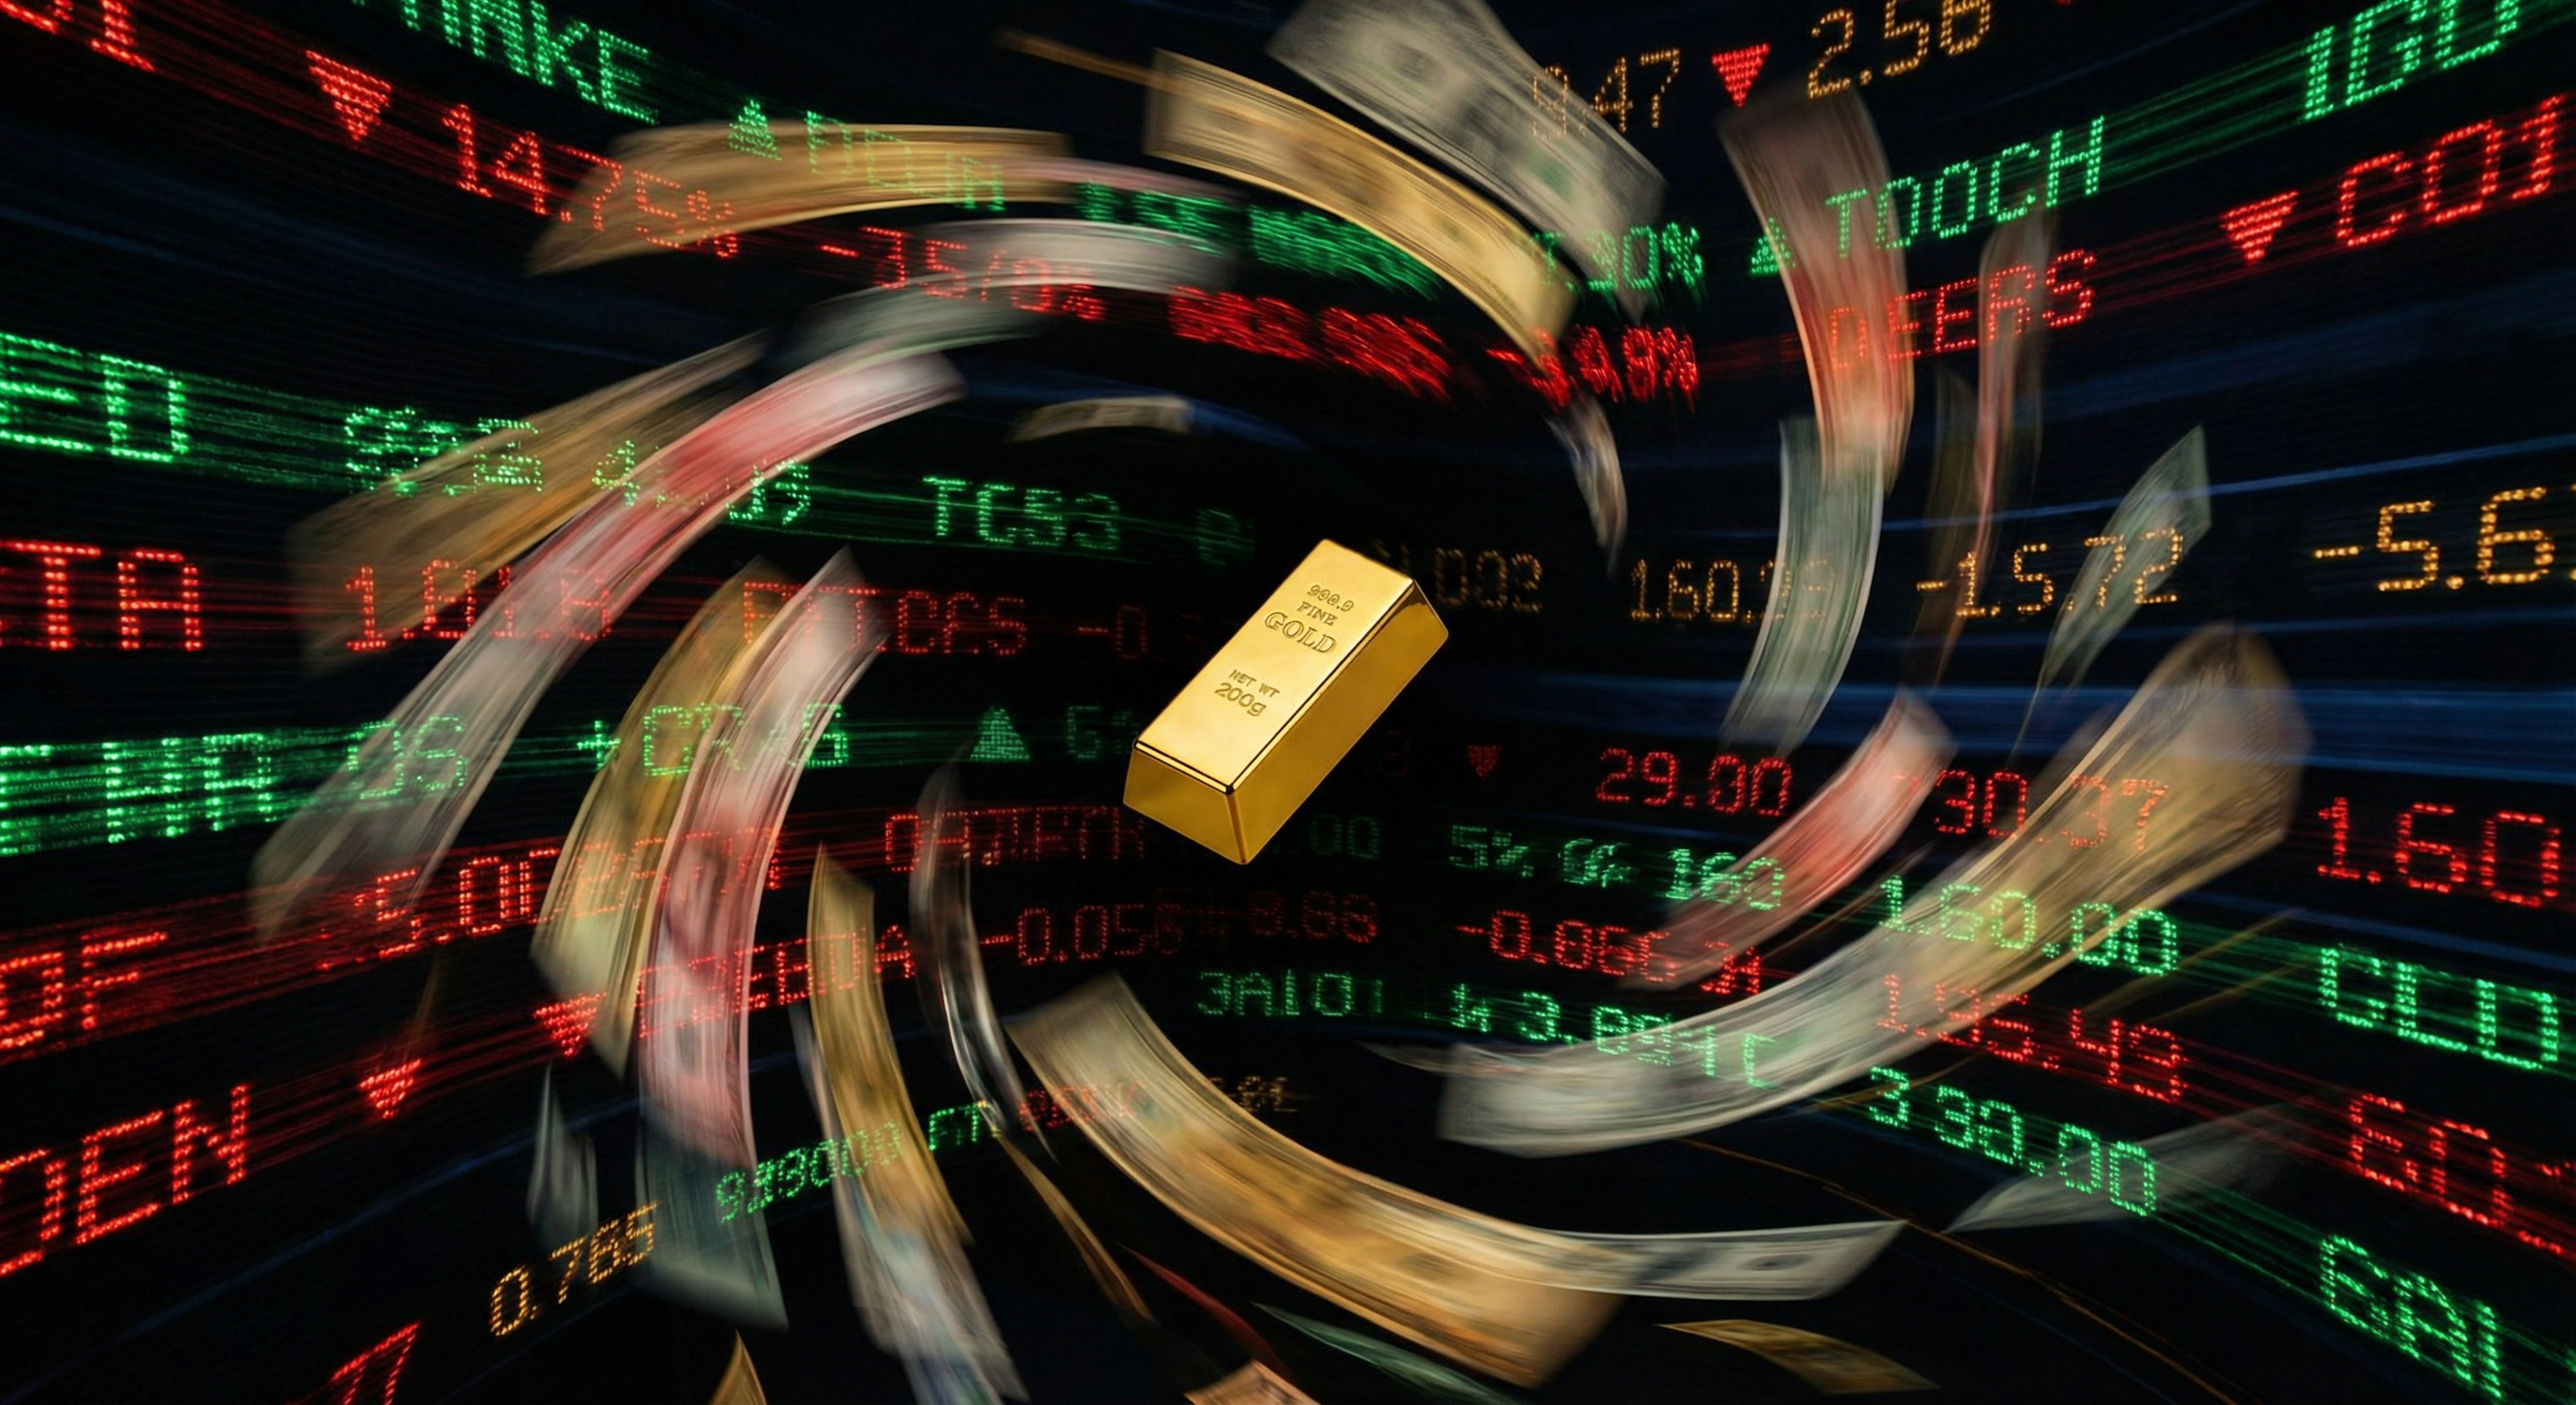
January 2026 marks a watershed moment for gold. After breaching $5,500 per ounce - a level that seemed ambitious even a year ago - the metal has defied skeptics who predicted a correction at each psychological barrier.
The rally isn’t driven by retail speculation or momentum trading. Central banks continue accumulating at an unprecedented pace, real yields remain negative for most households despite nominal rate increases, and geopolitical fragmentation shows no sign of easing.
This report examines what’s driving gold higher, the risks to the current trend, and our outlook for the months ahead.
Market performance
Price action in January
Gold opened 2026 at $5,180 and reached $5,540 by month-end, a gain of 6.9%. The move was orderly rather than parabolic - consolidation at $5,200 and $5,400 preceded each leg higher.
| Metric | January 2026 | vs. Prior Month | vs. Prior Year |
|---|---|---|---|
| Spot Price (Month-End) | $5,540 | +6.9% | +47.2% |
| Monthly High | $5,567 | - | - |
| Monthly Low | $5,145 | - | - |
| Average Price | $5,312 | +5.8% | +41.6% |
Regional variations
London and New York prices tracked closely, with the typical 50-basis-point spread. Asian premiums told a more interesting story:
- China: Shanghai Gold Exchange premiums averaged $6-8 above spot, reversing December discounts
- India: Local premiums surged to $112 - the highest in a decade - amid import duty speculation
- Singapore & Hong Kong: Trading near parity, with modest premiums on physical bars
Demand analysis
Central bank buying
Central bank purchases remain the dominant demand driver. The World Gold Council’s preliminary data shows:
- 2025 Total: 1,089 tonnes (third consecutive year above 1,000 tonnes)
- Monthly Average: 85-90 tonnes
- Key Buyers: China (reported 225 tonnes through November), Poland, Singapore, India
China’s central bank paused reported purchases in late 2024, but analysts suspect off-market accumulation continues. Turkey and several Gulf states have also increased reserves without formal disclosure.
“Central banks are structurally shifting away from dollar reserves. This isn’t a trade - it’s a generational reallocation.” - State Street Global Advisors
Investment demand
ETF holdings stabilized after 18 months of outflows. January saw modest inflows of 12 tonnes to gold-backed ETFs globally, the first positive month since March 2024.
Physical retail demand varies by region:
- UK/Europe: Strong, driven by inflation hedging
- US: Moderate, with premium spikes on popular bullion products
- Asia: Mixed - India active ahead of potential tax changes, China steady despite high prices
Jewelry & Industrial
Jewelry fabrication continues to struggle at current prices. Indian demand dropped 18% quarter-over-quarter, while Chinese retail jewelry purchases fell 12%. This is expected behavior at record highs - jewelry demand is price-elastic in ways investment demand is not.
Supply dynamics
Mine production
Global mine output held steady at approximately 3,600 tonnes annually. Key developments:
- Cost Inflation: All-in sustaining costs (AISC) average $1,340/oz, up 8% year-over-year
- Margins: At $5,500 gold, producers enjoy 75%+ margins - yet share prices lag
- New Projects: Limited major discoveries; most production growth comes from existing operations
Recycling
Scrap supply increased 15% in January as consumers sold old jewelry into the rally. This is typical at new price highs but unlikely to offset structural demand imbalances.
Macro environment
Real yields
The apparent contradiction of gold rallying alongside rising nominal interest rates reflects persistent negative real yields for most households.
| Measure | Current | 12 Months Ago |
|---|---|---|
| 10-Year Treasury | 4.8% | 4.2% |
| 10-Year TIPS | 1.8% | 1.4% |
| CPI (Official) | 2.9% | 3.1% |
| CPI (Shelter, Food, Energy) | ~4.5% | ~4.8% |
For households whose spending concentrates on essentials, real yields remain materially negative. Gold’s zero yield becomes competitive when alternatives offer negative real returns.
Currency dynamics
The dollar weakened modestly in January (DXY -1.2%) but remains strong by historical standards. Gold’s rise despite a firm dollar suggests demand drivers extend beyond simple currency hedging.
Commodity currencies strengthened:
- AUD: +4.2% since December
- CAD: +3.1% since December
This complicates monetary policy in gold-producing nations as terms of trade improve.
Geopolitical backdrop
No single event drove January’s rally, but the accumulation of geopolitical tensions persists:
- US-China trade friction remains elevated
- Russia sanctions continue, with secondary effects on dollar reserve willingness
- Middle East instability adds periodic safe-haven bids
Technical and positioning context
Weekly RSI sat above 70 for much of January — a reading conventionally associated with overbought conditions, although the equivalent readings in 2024 and 2025 resolved through sideways consolidation rather than corrections. The metal advanced through round numbers ($5,000, $5,200, $5,400) without the speculative climaxes typically associated with blow-off tops; volume was orderly and breadth across regions was uniform, both of which are usually read as accumulation rather than speculative froth.
Technical levels matter for traders watching the chart, but level-by-level commentary is not the point of this report. The structural drivers — central bank buying, real-yield dynamics, geopolitical risk — remain the primary read on whether the move is durable.
Mining equities
Mining equities continued to lag the metal in January. Major US-listed precious-metals miner indices rose roughly half as much as the gold spot price across the month, leaving the historical discount between producer NAVs and share prices wider than it has been since 2020.
At current valuations, major producers trade at roughly 0.8x NAV against a historical average closer to 1.2x. Several explanations are plausible:
- Scepticism about price sustainability — equity investors are pricing a partial mean-reversion of the gold price
- Cost inflation concerns — AISC at $1,340/oz is up 8% year-on-year and margins could compress if input costs rise further
- ESG / permitting risks — new projects face regulatory headwinds in several jurisdictions
- Capital-allocation history — earlier cycles saw value destruction through poor M&A, and that memory still weighs
Mining equities are securities, not commodity exposure: their price is influenced by the gold price but also by company-specific operational, jurisdictional, hedging, and equity-market factors. They are controlled investments under FSMA. UK readers considering them should research individual issuers through their own broker, read the relevant fund factsheets, and consult a regulated adviser on suitability.
Sister metals
Silver
Silver trades at a 95:1 ratio to gold, well above the 70:1 historical average. The metal carries industrial demand drivers (solar, electronics) that gold does not. Whether the ratio normalises is contingent on industrial demand growth, mine supply response, and the financial-market behaviour of speculative silver positioning — none of which is reliably predictable.
January performance: Silver +5.8%, lagging gold once again.
Platinum
Platinum’s 72% discount to gold is the widest since 2015. Automotive demand remains weak as EV adoption reduces catalytic converter requirements. Supply constraints in South Africa and Russia could tighten the market, but this hasn’t translated to prices yet.
Risk factors
Near-term risks
- Position crowding: Speculative longs are elevated but not extreme by historical standards
- Dollar rally: A sharp dollar move higher would pressure gold regardless of fundamentals
- Physical demand fatigue: Jewelry and retail investment may weaken further at current prices
Tail risks
- Central bank policy shift: If major buyers pause or reverse purchases
- Geopolitical détente: Reduced safe-haven demand
- Real yield spike: A genuine return to positive real rates for savers
What could change the picture
Rather than issue a price forecast — gold is too volatile and too event-dependent for that to be honest analysis — it is more useful to set out the conditions under which the current backdrop changes.
- Sustained scenario — central banks continue to buy at the 2025 run-rate, the dollar remains range-bound or weakens, no major geopolitical de-escalation. This describes the conditions that drove the move to $5,500.
- Upside scenario — ETF inflows accelerate, India’s budget delivers clarity on import duty, and Asian retail demand picks up alongside the Lunar New Year window.
- Downside scenario — concentrated profit-taking after the extended rally combined with temporary dollar strength. Past cycles suggest these episodes can be sharp but tend to be measured in weeks rather than quarters.
These are conditions to watch, not forecasts. No probabilities are attached because the variables are too interconnected to model honestly. Anyone making a position decision on the back of monthly analysis should consult a regulated adviser.
What to watch
- February 1 India Budget: Import duty changes could significantly impact Asian demand
- Fed Guidance: Language on inflation trajectory and rate path
- China Central Bank Reports: Whether official purchases resume
- ETF Flows: Direction and magnitude of institutional positioning
- Mining M&A: Consolidation could re-rate the sector
Conclusion
Gold’s rally has exceeded most expectations, yet the structural drivers — central bank accumulation, compressed real yields, geopolitical hedging — show no signs of reversal. At $5,500, the metal is not cheap by any historical measure. The market has been content to reprice anyway, because structural demand has outstripped supply.
Whether the repricing continues or stalls from here is genuinely uncertain. Corrections along the way are a normal feature of any extended move, not a directional signal. None of the above is a recommendation on whether to add, hold, or reduce exposure to gold in any specific form — that decision belongs with a regulated adviser who knows the reader’s circumstances.
For the structural picture: gold is expensive by every historical measure. The reasons it became expensive (central bank accumulation, real-yield compression, geopolitical fragmentation) have not so far reversed. Whether they continue to support these levels through 2026 is the open question.
This report reflects market conditions and data available as of January 30, 2026. Past performance does not guarantee future results. This is not financial advice.