
Weekly Roundup
Gold Drops Below £3,300 as Rate Optimism Triggers Sharp Pullback
Gold fell 3.6% to £3,297/oz ($4,173) while silver shed 7.4% to £51.28/oz in the sharpest weekly decline since early 2026.
Read more
What's happening in gold, silver, and metals markets right now. Price moves, policy changes, and what's worth paying attention to.
Gold fell 3.6% to £3,297/oz ($4,173) while silver shed 7.4% to £51.28/oz in the sharpest weekly decline since early 2026.

For the first time, gold has overtaken US Treasuries as the world's second-largest reserve asset - a structural shift that redefines how central banks think about safety.

Gold climbed 2.1% to £3,628/oz this week while silver drifted lower, pushing the gold/silver ratio to 60.5.
Gold dipped 0.64% to £3,573/oz ($4,523) while silver shed 1.13% to £60.20/oz in a quiet week of profit-taking.

Gold fell to £3,604/oz ($4,562) while silver dropped 9.3% in a sharp risk-off week for precious metals.

Gold closed at £3,737/oz (+4.7%) while silver soared 10.7% to £63.88/oz, compressing the gold/silver ratio to 58.5.
Gold is consolidating just below recent highs, supported by a Federal Reserve in no hurry to cut and a geopolitical backdrop that continues to reward safe-haven positioning.

Gold's 3.6% monthly decline alongside silver's flat performance reveals a precious metals complex losing conviction from both safe-haven and industrial demand sides simultaneously.
Gold has shed 1.6% this week as traders de-risk ahead of the Federal Reserve's rate decision, yet structural demand from central banks and persistent inflation fears suggest this pullback may be.
Gold closed the week at $4,879.60 - up almost 3% - even as easing geopolitical tensions around Iran should, in theory, have taken the wind out of the safe-haven trade.
For the first time, gold has overtaken US Treasuries as the world's second-largest reserve asset - a structural shift that redefines how central banks think about safety.
France is booking $15 billion in revaluation profits, China is still accumulating, and Turkey is monetising its reserves - the official sector's gold playbook is diverging in ways that reinforce the.
The Reserve Bank of India has lifted gold's share of its foreign exchange reserves to a new high, reinforcing a structural demand trend that underpins prices even as spot gold pulls back from April's.
The Bank of France has crystallised an estimated $15 billion profit from gold transactions, underscoring just how dramatically central bank reserve strategies have evolved in the current bull market.
Revelations tying Colombian cartel-linked gold to the Royal Canadian Mint raise serious questions about due diligence across the entire refining industry - and could reshape how sovereign.
Four consecutive quarters of record free cash flow at Kinross Gold underscore how elevated gold prices are transforming miner balance sheets - and what that means for shareholder returns across the.
A massive collapse in gold ETF inflows has done almost nothing to dent a metal still trading above $4,600, revealing just how much the demand picture has shifted away from Western financial products.
Endeavour Mining's record Q1 EBITDA and free cash flow underscore how gold above $4,600 is transforming producer economics - yet mining equities remain stubbornly discounted to the metal itself.
Barrick Gold's push toward acquisitions and asset spinoffs marks a pivotal shift in major producer strategy - one that could reshape the North American gold mining landscape with spot prices near.
G Mining Ventures' all-share acquisition of G2 Goldfields signals that mid-tier producers are scrambling to lock in growth assets while gold trades near $4,800 - and Guyana is fast becoming the.
Washington state's decision to impose a 10.3% sales tax on precious metals is driving dealers out entirely - a cautionary signal for the broader retail bullion market as gold trades near $4,700.

Versamet Royalties' $360 million gold stream on Skeena's Eskay Creek signals that streaming companies are racing to secure high-grade ounces while gold trades near historic highs - and miners are.

India's decision to let equity mutual funds allocate up to 35% to gold and silver could unlock billions in new institutional demand for precious metals at a time when prices are already near record.

A sharp downgrade in the near-term silver price target from $100 to $85 reflects rising mine supply and softening industrial demand, yet the metal's fundamentals remain more nuanced than the headline.

A major Wall Street forecast places gold near $5,900 by late 2026, yet the metal's recent slide from near $4,880 to $4,585 is forcing bulls to reconcile lofty targets with short-term weakness.

UBS has cut its silver price forecasts across multiple timeframes, injecting a bearish note into a market that has still gained over 4% this month alone.
Goldman Sachs has set a structurally bullish gold target of $5,400, yet with the metal already down nearly 3% this week, the near-term path looks far less straightforward than the long-term thesis.
Gold fell 3.6% to £3,297/oz ($4,173) while silver shed 7.4% to £51.28/oz in the sharpest weekly decline since early 2026.
Gold climbed 2.1% to £3,628/oz this week while silver drifted lower, pushing the gold/silver ratio to 60.5.
Gold dipped 0.64% to £3,573/oz ($4,523) while silver shed 1.13% to £60.20/oz in a quiet week of profit-taking.
Gold fell to £3,604/oz ($4,562) while silver dropped 9.3% in a sharp risk-off week for precious metals.

Everything is selling off - but money doesn't disappear. It moves. Here's the interactive map of where capital is flowing in March 2026.
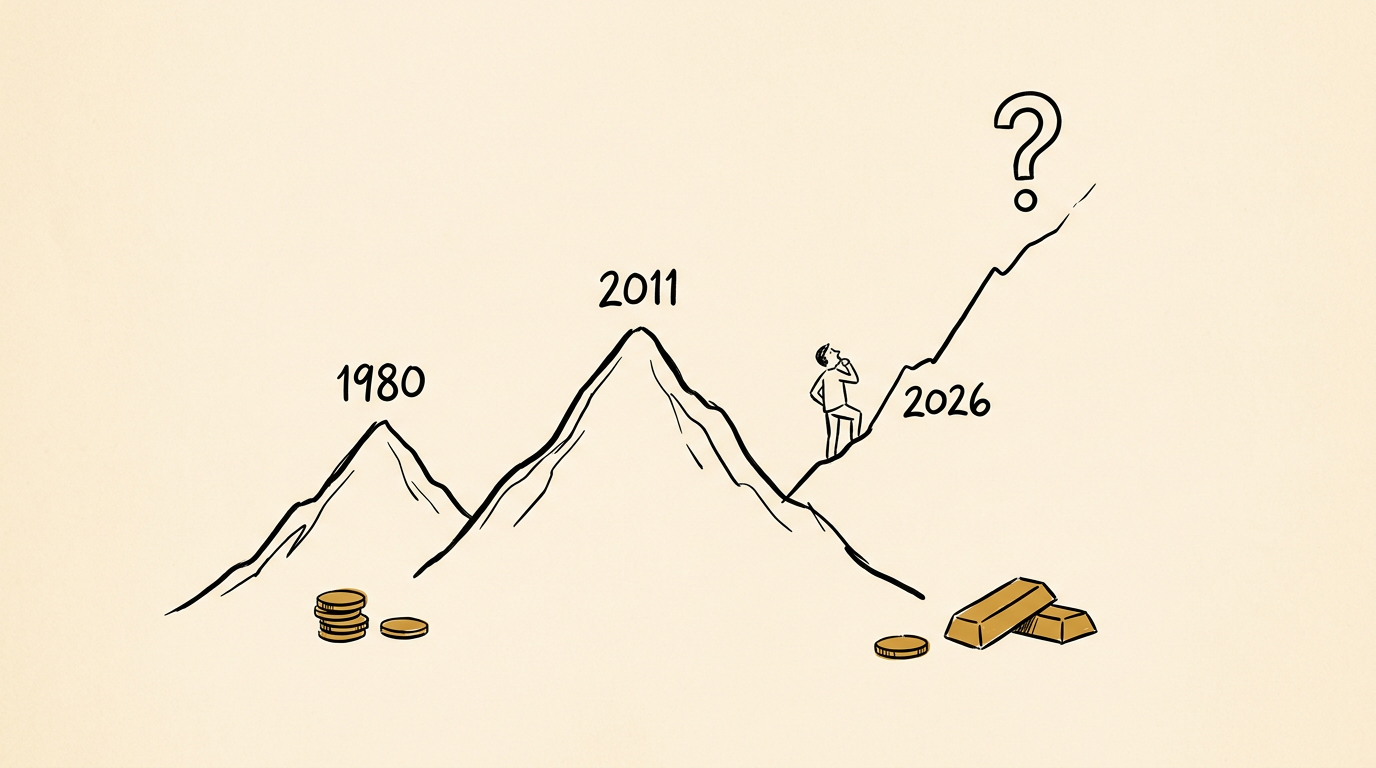
Nine indicators across price, duration, valuation, and macro context suggest where this gold cycle sits after the January spike to $5,600.
436 articles