On this page

Gold’s Structural Bid - Dollar Reserves Hit 30-Year Low
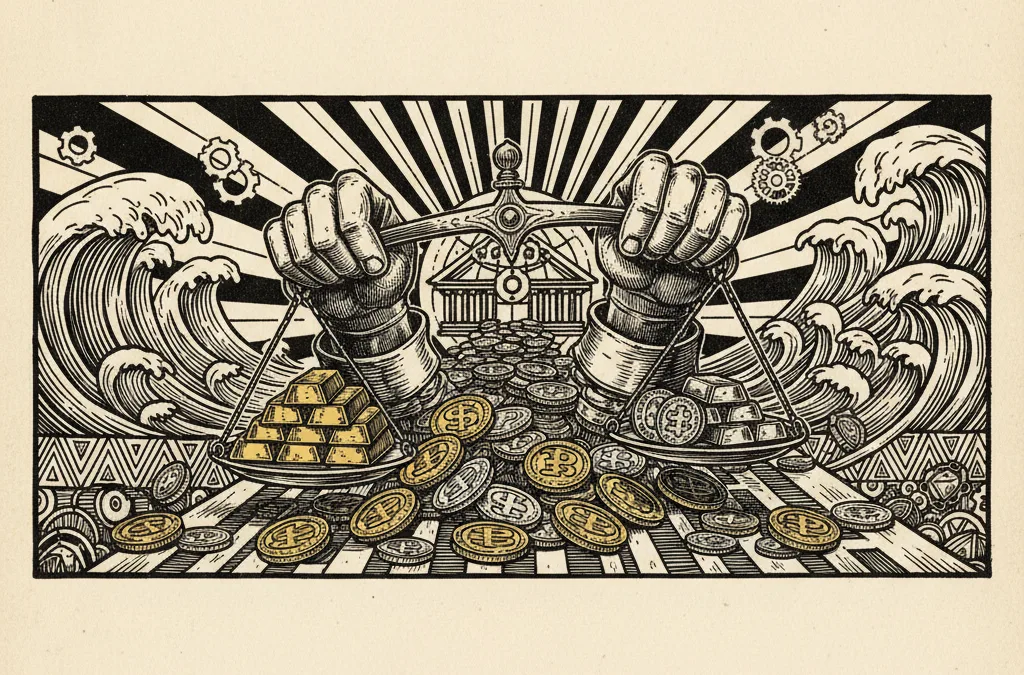
The US dollar’s share of global reserves has fallen to its lowest level since the mid-1990s, and central banks are funnelling the difference into gold - a structural shift that underpins prices even through sharp corrections.
What to know
-
IMF reserve data shows the US dollar’s share of allocated global reserves has dropped to a 30-year low, with central banks actively diversifying into gold and alternative currencies.
-
Gold is trading at $4,615.80/oz after a 9.6% pullback from its March high of $5,303.80 - yet the broader trend remains supported by persistent sovereign demand.
-
The gold-to-silver ratio sits at 62.9, suggesting silver may be positioned for relative outperformance if the macro tailwinds from de-dollarisation persist.
What happened
IMF reserve composition data now confirms what precious metals markets have been pricing in for years: the US dollar’s share of global allocated reserves has slipped to roughly 57%, its lowest reading since the mid-1990s. The decline has accelerated since 2020, shedding several percentage points in a timeframe that would have seemed implausible a decade ago.
Central banks have rotated into the euro, the Chinese renminbi, and a basket of smaller currencies - but gold is the standout winner. World Gold Council figures indicate that official sector purchases have exceeded 1,000 tonnes annually for three consecutive years, a pace of accumulation not seen since the Bretton Woods era. Gold now represents a materially larger share of total reserves for a growing number of central banks, particularly across Asia, the Middle East, and parts of Eastern Europe.
Gold itself sits at $4,615.80 today, essentially flat on the session but up 1.45% on the week. The monthly picture tells a more volatile story - a 9.6% drawdown from the $5,303.80 high printed earlier in March. That kind of correction tends to shake out leveraged speculative longs, but it does little to deter sovereign buyers operating on multi-year mandates.
Who’s involved
The People’s Bank of China remains the most closely watched player, having disclosed intermittent but substantial gold purchases over the past three years. Poland’s central bank has been another aggressive accumulator, along with India’s Reserve Bank and Turkey’s central bank. These institutions are not trading gold - they are building strategic positions.
On the other side, the US Treasury and Federal Reserve face a quieter but consequential challenge. Dollar reserve erosion does not mean a dollar crisis is imminent - the greenback still dominates global trade settlement and debt markets. But the trend is directional, and it narrows the margin of comfort for US fiscal policy at a time when deficit spending remains elevated.
Currency markets are watching too. China’s NBS Manufacturing PMI data, due out today, will offer a fresh read on the world’s largest gold-importing economy. Any upside surprise could reinforce expectations for continued Chinese demand across commodities, including gold.
Why it matters
The structural case for gold has shifted over the past five years from a primarily inflation-hedge narrative to something broader - a reserve diversification play driven by geopolitics and sovereign risk management. When central banks buy gold at this pace, they create a floor under prices that is largely independent of interest rate cycles or ETF flows.
This matters for the current correction. Gold dropping from $5,303 to $4,100 and then recovering to $4,615 within a single month is extreme volatility by historical standards. But the sovereign bid means dips are being absorbed rather than amplified. Silver, trading at $73.39 with an 11.5% monthly decline, has been hit harder - typical behaviour for the more speculative metal - but the gold-silver ratio at 62.9 is relatively compressed compared to stress periods, suggesting the broader complex retains underlying strength.
The post-2008 period offers a useful comparison. Central banks pivoted from being net sellers to net buyers of gold, a transition that took years to fully register in prices but ultimately underpinned the move from $800 to $1,900. The current de-dollarisation wave is a similar slow-burn structural force.
What happens next
The next IMF COFER release will show whether dollar reserve declines are accelerating or plateauing. Chinese manufacturing data today will signal whether physical gold demand through Shanghai remains robust. The $4,500 level in gold has acted as support twice this month - a decisive break below would suggest the correction has further to run despite the structural bid.
This article is for informational purposes only and does not constitute financial advice. Always do your own research before making investment decisions.