On this page

Gold’s Central Bank Bid Keeps Building - Even at $4,800
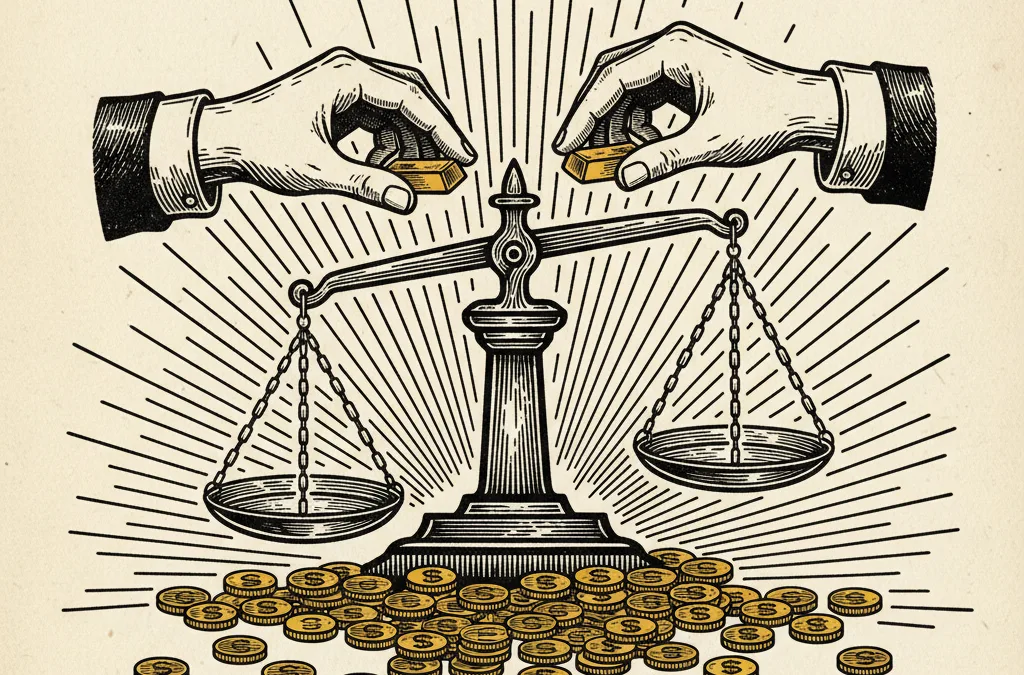
Sovereign buyers and institutional allocators continue to accumulate gold at levels that would have seemed absurd five years ago, fundamentally reshaping the demand floor beneath precious metals.
What to know
-
Central bank gold purchases have remained elevated through 2026, with sovereign buyers showing little price sensitivity even as gold trades near $4,800/oz.
-
The gold/silver ratio has compressed to 63.4, suggesting institutional demand is broadening across the precious metals complex.
-
Today’s US Core PCE and GDP data could inject fresh volatility into a market already digesting a 3.3% weekly gold rally.
What happened
Gold is trading at $4,810 after a 3.3% weekly surge, consolidating within a wide monthly range of $4,100 to $5,229. Central bank accumulation - the dominant structural force in precious metals markets since 2022 - shows no sign of slowing. World Gold Council figures indicate that official sector purchases have consistently exceeded 1,000 tonnes annually for three consecutive years, a pace that has no modern precedent.
The weekly rally has been broad-based. Silver has outperformed gold with a 4.5% gain to $75.92, platinum has surged 7.5% to $2,105, and palladium has added 6.1% to reach $1,566. The entire precious metals complex is catching a bid. The compression of the gold/silver ratio to 63.4 suggests capital is flowing into the sector rather than chasing a single safe haven.
Who’s involved
The buyer list reads like a geopolitical map. China, India, Poland, Turkey, and a growing roster of emerging market central banks have been steadily converting dollar reserves into physical gold. The motivation is straightforward - reserve diversification away from USD-denominated assets in a world where sanctions risk and fiscal deficits have made sovereign wealth managers rethink their playbooks.
Institutional allocators are following the sovereign lead. Pension funds and family offices that historically held 2-5% in gold are now running allocations closer to 8-12%. The shift is structural, not tactical. These are not momentum traders chasing a breakout - they are long-duration holders building positions they intend to maintain for years.
On the other side, Western ETF flows have been more mixed. Retail participation has ebbed and flowed with price action, but the underlying bid from official and institutional buyers has created a demand floor that simply did not exist a decade ago.
Why it matters
The market structure of gold has fundamentally changed. When central banks were net sellers in the early 2000s, gold struggled to hold $400. Now, with sovereign buyers absorbing over a quarter of annual mine supply, the price discovery mechanism operates on entirely different terms. Dips that would have triggered cascading liquidations in 2015 are now met with physical buying from entities with essentially unlimited balance sheets.
The broadening rally into silver and platinum suggests the thesis is expanding beyond gold alone. Silver’s dual role as a monetary and industrial metal makes it particularly interesting at current levels - a gold/silver ratio of 63.4 is well below the 80+ readings that prevailed during gold-only rallies of the past.
Today’s US economic data - Core PCE and GDP figures - will test the market’s conviction. A hotter-than-expected inflation print could reinforce the case for gold as an inflation hedge, while weaker GDP data might accelerate the flight to safety. Either outcome arguably supports the metal at these levels, which tells you something about the asymmetry of the current setup.
For those looking to understand how gold sovereigns fit into this broader picture of sovereign accumulation, the parallels between national reserve building and individual portfolio construction are worth considering.
What to watch
The Core PCE print landing today is the immediate catalyst. Any reading above 0.3% month-on-month would likely push gold back towards the $4,900 level. Initial jobless claims data will also signal whether the US labour market is finally cracking under the weight of elevated rates.
Three things matter beyond this week. First, whether the gold/silver ratio breaks below 60 - that would confirm a genuine broadening of precious metals demand. Second, any signals from the People’s Bank of China on reserve composition in Q1 data. Third, whether platinum’s 7.5% weekly surge marks the beginning of a sustained catch-up trade or just short-covering.
This article is for informational purposes only and does not constitute financial advice. Always do your own research before making investment decisions.