On this page

Gold’s Central Bank Bid Broadens Even as Pace Slows
January’s central bank gold purchases dipped from 2025’s torrid pace, but the number of countries actively adding reserves is quietly expanding - a structural shift that matters more than any single month’s tonnage.
What to know
-
Central bank gold buying momentum eased in January 2026, but the pool of active sovereign buyers has widened, suggesting demand is becoming more entrenched rather than fading.
-
Gold is trading at $5,200.70/oz, up 5.7% over the past month, with the broadening central bank demand base providing a durable floor beneath prices.
-
Key macro data this week - including US ADP employment, ISM Services PMI, and China’s NBS Manufacturing PMI - could influence the dollar trajectory and near-term gold positioning.
What happened
Central bank gold purchases in January 2026 came in below the monthly averages that defined 2025’s record-setting accumulation cycle. The headline number suggests a cooling trend, and on the surface, that’s a reasonable read. But the underlying data shows a more nuanced pattern: the number of central banks actively adding gold to reserves has expanded. More countries are buying, even if individual purchase sizes have moderated.
The initial wave was dominated by a handful of heavy hitters - China’s PBOC, Poland’s NBP, and a rotating cast of emerging-market central banks. What’s shifted is the breadth. Smaller reserve managers across Southeast Asia, Latin America, and the Middle East are now consistently appearing as net buyers, month after month.
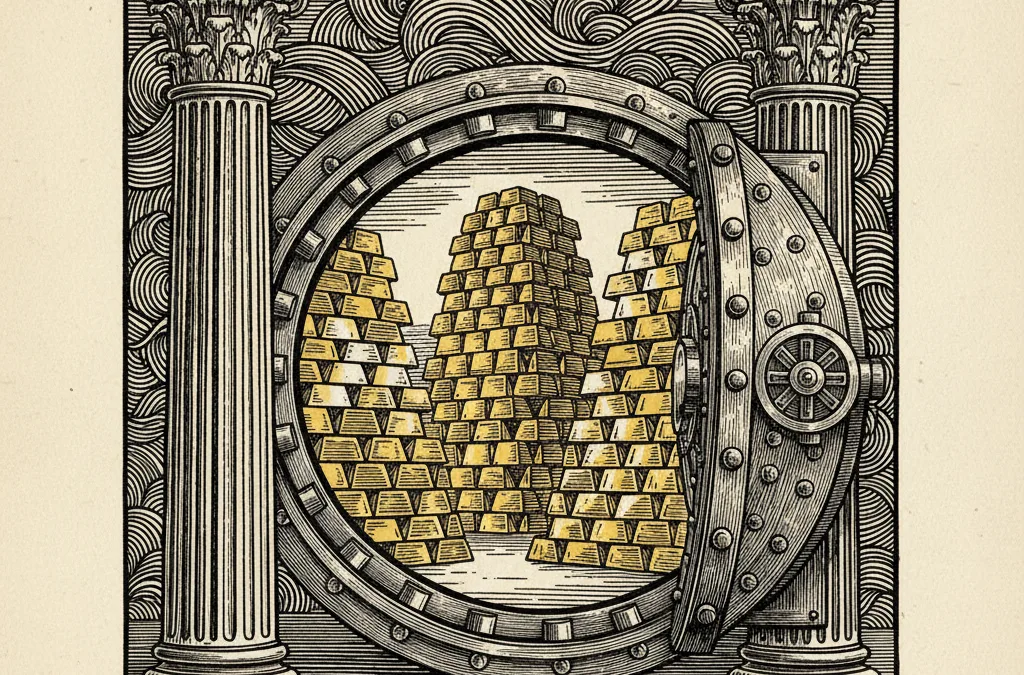
Gold itself reflects this structural underpinning. At $5,200.70/oz, the metal is up 5.7% over the past month alone, having traded in a wide $4,655–$5,405 range. That kind of volatility with a persistent upward bias doesn’t happen without deep, patient institutional buying beneath the surface.
Who’s involved
The usual suspects remain active. China’s reserves data continues to show incremental additions, though the pace has clearly moderated from the aggressive accumulation seen through mid-2025. Poland has been one of the most transparent and aggressive buyers in the developed-market space, and there’s no sign that posture has changed.
What’s more interesting is the second tier. Central banks in countries like the Czech Republic, India, and several Gulf states have shifted from occasional opportunistic buyers to systematic accumulators. This broadening base means the demand picture is less dependent on any single institution’s policy decisions - and therefore more resilient.
On the sell side, the picture remains thin. Net selling among central banks has been negligible for over two years now. The old dynamic where Western central banks periodically offloaded reserves feels like ancient history.
Why it matters
A single month’s slowdown in tonnage is noise. The broadening of the buyer base is signal.
When demand is concentrated among two or three large buyers, it’s vulnerable to policy shifts - a new PBOC governor, a change in fiscal priorities, sanctions relief that reduces the urgency to diversify away from dollar reserves. But when 15 or 20 central banks are independently reaching the same conclusion - that gold deserves a larger share of reserves - you’re looking at a structural trend that’s far harder to reverse.
This dynamic also helps explain why gold has held above $5,000 despite periodic bouts of dollar strength and rising real yields in certain maturities. The sovereign bid acts as a floor, absorbing dips that might otherwise trigger technical selling cascades. The gold/silver ratio at 60.6 suggests gold’s premium positioning relative to industrial metals remains firmly intact.
Historically, the closest parallel is the 2010–2012 period when emerging-market central banks began diversifying in earnest. That cycle added roughly $700/oz to gold’s price over two years. The current cycle, supercharged by geopolitical fragmentation and de-dollarization pressures, has been far more powerful.
What to watch
This week’s macro calendar is dense and relevant. US ADP employment data and the ISM Services PMI landing today will shape dollar expectations - and by extension, the opportunity cost calculus for non-yielding gold. China’s NBS Manufacturing PMI, also due today, matters because a weakening Chinese economy historically correlates with accelerated PBOC gold purchases as policymakers seek stability anchors.
Beyond the weekly calendar, three things matter: whether the PBOC resumes larger monthly additions after its recent moderation, whether any G7 central bank breaks ranks and begins actively accumulating, and whether the $5,000 level holds as the new structural floor on any pullback.
This article is for informational purposes only and does not constitute financial advice. Always do your own research before making investment decisions.
Sources & Data
- World Gold Council - quarterly Gold Demand Trends report
- ONS - ONS Retail Price Index data