On this page

Gold Holds $4,680 as Iran Fears Meet Central Bank Bid
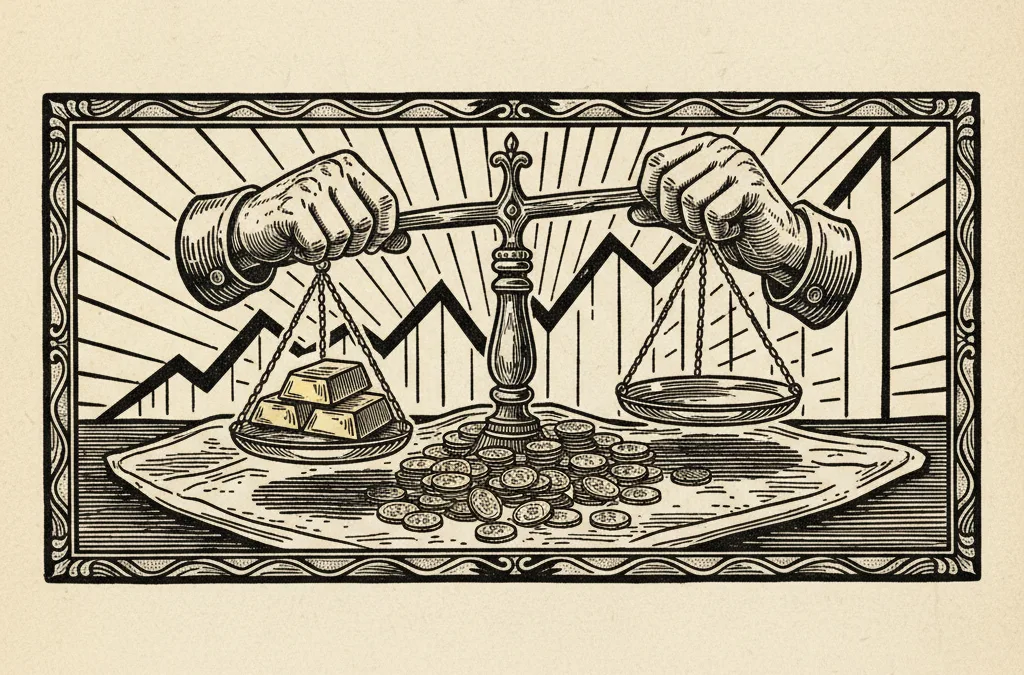
Gold is consolidating near $4,680 after a brutal 9% monthly drawdown, but persistent geopolitical risk and relentless central bank accumulation are building a floor that bears may struggle to break.
What to know
-
Gold traded in a wide $4,626 - $4,733 range on Monday, settling near $4,682 as escalating Iran tensions offset recent profit-taking from March highs above $5,200.
-
Central bank gold purchases continue to underpin demand, with sovereign buyers treating any dip below $4,700 as a buying opportunity.
-
The gold-silver ratio sits at 63.9, with silver underperforming gold on the week - down nearly 2% versus gold’s 0.75% gain - suggesting risk appetite remains fragile.
What happened
Gold spent Monday grinding through a $107 intraday range, touching $4,626 before recovering to close near $4,682. The gold price is up 0.75% on the week but remains sharply lower on the month - down $464, or just over 9%, from the highs above $5,229 printed in early March.
That monthly decline needs context. Gold’s retreat from the $5,200 area looks dramatic in dollar terms, but it represents a standard correction within a trend that has seen the metal more than double over the past two years. The current consolidation zone around $4,650 - $4,700 is acting as a battleground between profit-takers and fresh safe-haven demand.
Escalating tensions around Iran are the immediate catalyst keeping a bid under the market. Any scenario involving supply disruption in the Strait of Hormuz - through which roughly a fifth of global oil passes - historically sends capital flooding into gold. That playbook is activating now.
Who’s involved
Three distinct buyer cohorts are shaping price action at these levels.
Central banks remain the structural force. Sovereign purchasers - particularly in Asia and the Middle East - have been accumulating gold consistently for over three years now. Their buying is price-insensitive in the traditional sense; they are diversifying reserves away from dollar-denominated assets, and a 9% pullback from all-time highs is an invitation, not a deterrent.
US retail and institutional investors are the second group. The safe-haven narrative is pulling capital back into gold ETFs after some outflows during March’s correction. With the ISM Services PMI data due today, any softness in the US economy would reinforce the case for holding gold as a hedge against both geopolitical and macro risk.
Speculative traders are working both sides. The wide daily ranges - over $100 on Monday alone - point to active positioning and repositioning. Open interest data suggests leveraged longs are rebuilding after the March washout.
Why it matters
The interplay between geopolitical risk and central bank buying creates a dynamic that is structurally different from previous gold cycles. In 2011, gold’s rally to then-record highs was driven primarily by monetary policy fears. Today’s bid is broader - it combines sovereign diversification, genuine conflict risk, and persistent inflation concerns.
Silver’s relative weakness is telling. The metal is down nearly 2% on the week and over 12.6% on the month, lagging gold significantly. When gold outperforms silver during a risk-off move, safe-haven flows - not industrial or speculative momentum - are driving the complex. For investors considering how to buy silver in the UK, the compressed gold-silver ratio at 63.9 may present a relative value opportunity if risk appetite returns.
Platinum and palladium are both firmer on the week - up 1.9% and 1.5% respectively - but these moves look more like short-covering than conviction buying.
What to watch
The $4,600 level is the line in the sand for gold bulls. A sustained break below would open up a move toward the monthly low near $4,100, which would represent a full 22% correction from the highs - technically entering bear market territory for the move.
A close above $4,750 would signal that the consolidation phase is ending and a retest of $5,000 is in play.
Three things matter this week. Any escalation in Iran - particularly involving naval movements or sanctions enforcement - will bid gold immediately. The ISM Services PMI reading today could shift dollar expectations, and a weak print would be gold-positive. Central bank reserve data from China and other major buyers, due later this month, will show whether sovereign accumulation accelerated during the March dip.
This article is for informational purposes only and does not constitute financial advice. Always do your own research before making investment decisions.