On this page
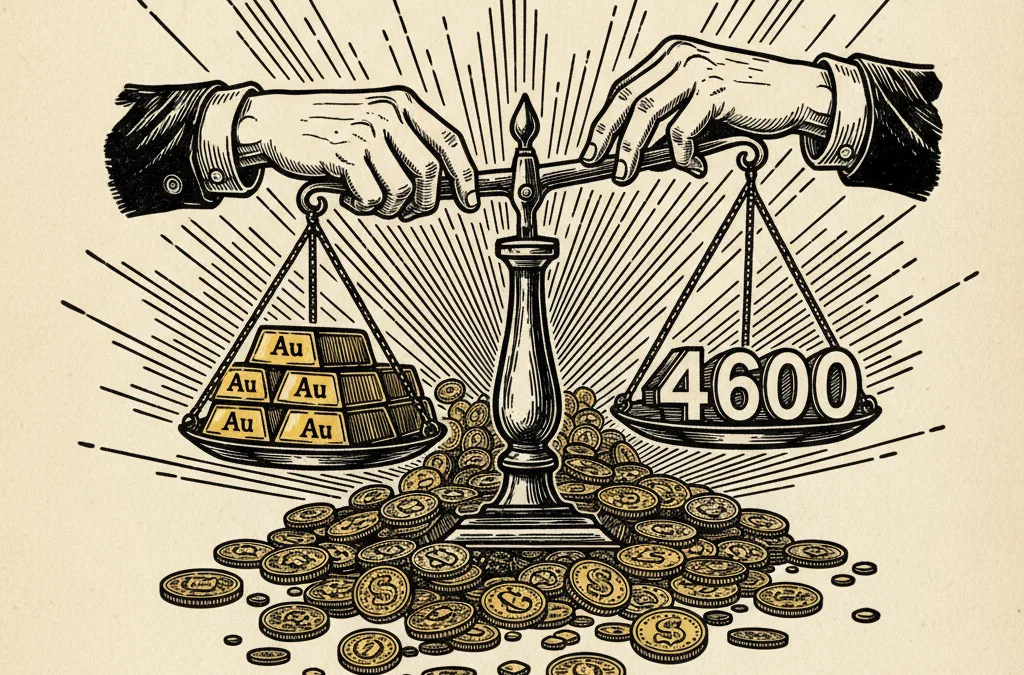
Gold Holds $4,600 Despite Sharp Monthly Drop
Central bank buying continues to underpin gold even after an almost 12% monthly decline, suggesting a structural floor that could limit further downside.
What to know
-
Gold is trading at $4,664 after a $630 monthly decline - yet sovereign demand appears to be capping losses around the $4,100 level.
-
Central banks have been net buyers for over 15 consecutive years, and 2025-2026 purchasing volumes remain historically elevated.
-
The gold/silver ratio sits at 65.4, a relatively compressed level that hints at broad precious metals strength rather than a gold-only trade.
What happened
Gold is trading near $4,664, barely changed on the session after a volatile week. The live gold price shows a 3.84% weekly gain against an 11.9% monthly decline from the $5,300+ highs seen in early March.
That monthly drawdown of roughly $630 would normally trigger further selling. Instead, the metal found strong buying interest near $4,100 and has since recovered more than $500 from that trough. The bounce has been orderly rather than frantic, which points to consistent, size-driven accumulation rather than speculative short-covering.
The intraday range today has been wide - spanning $4,580 to $4,826 - yet the close is gravitating towards the middle.
Who’s involved
Central banks remain the dominant force beneath this market. Sovereign buyers have been net accumulators of gold for over 15 years running, and the pace of purchases through late 2025 and into 2026 has shown no sign of slowing. China’s People’s Bank, the Reserve Bank of India, and several Eastern European central banks - notably Poland and the Czech Republic - have been the most visible accumulators.
This cycle differs from earlier central bank buying waves in its breadth. It is no longer just emerging market central banks diversifying away from dollar reserves. Several G10-adjacent institutions have quietly added to gold allocations, treating the metal as a hedge against fiscal fragility and geopolitical fracture.
On the other side, speculative positioning has thinned after the sharp correction from $5,405. Managed money longs were trimmed aggressively during the March sell-off, which paradoxically leaves the market in a healthier position - less crowded and more responsive to fundamental demand.
Why it matters
The structural bid from central banks is reshaping how gold corrections behave. In previous cycles, a near-12% monthly decline would often cascade into further selling as momentum traders piled in on the short side. This time, sovereign demand is absorbing supply at levels that would have been unthinkable two years ago.
Gold at $4,100 - the recent monthly low - would have been an all-time record as recently as mid-2025. That this level now represents a correction floor speaks to how dramatically the demand landscape has shifted.
Silver’s parallel resilience is worth noting. At $71.31, it has pulled back nearly 20% from recent highs but maintains a gold/silver ratio of 65.4 - well below the 80+ levels that characterised previous risk-off environments. Platinum at $1,938 and palladium’s 6.3% weekly surge further suggest the precious metals complex is being supported by structural forces, not just flight-to-safety flows.
With US initial jobless claims and goods trade balance data due today, any softness in the labour market or widening of the trade deficit could reinforce the macro case for gold. Sterling-focused investors should also watch UK DMP inflation expectations data, which could influence Bank of England rate path expectations and, by extension, GBP-denominated gold.
What to watch
The $4,100 level is the line in the sand. If central bank buying continues to defend that zone, it establishes a credible floor roughly 24% below the all-time high near $5,405 - a normal correction depth in a secular bull market.
Three things matter now. First, whether managed money positioning rebuilds from current lean levels - that would signal fresh speculative conviction. Second, any official reserve data from China or India confirming continued purchases at these elevated price levels. Third, the $4,825-$4,850 resistance zone, which capped today’s rally and represents the gateway back towards $5,000.
Central bank demand at $4,100 suggests a floor. Whether it holds through the next macro shock remains untested.
This article is for informational purposes only and does not constitute financial advice. Always do your own research before making investment decisions.