On this page
Gold at $5,100 - But the Big Banks Can’t Agree
Major institutional forecasts for gold in 2026 are diverging sharply even as the metal consolidates near $5,100, revealing deep disagreement about where macro risks sit from here.
What to know
-
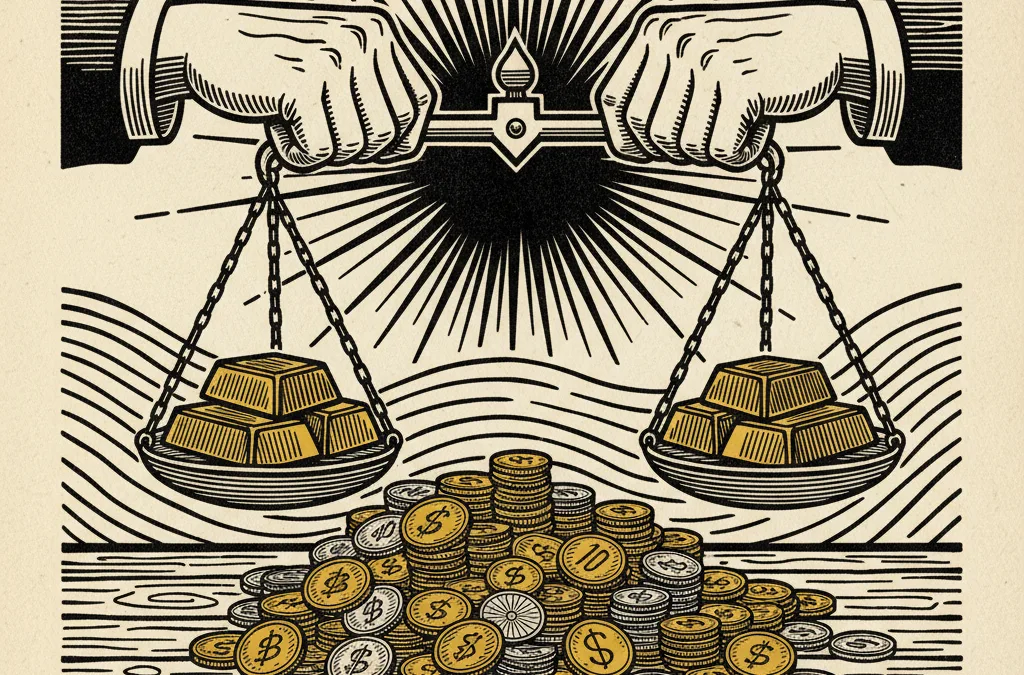
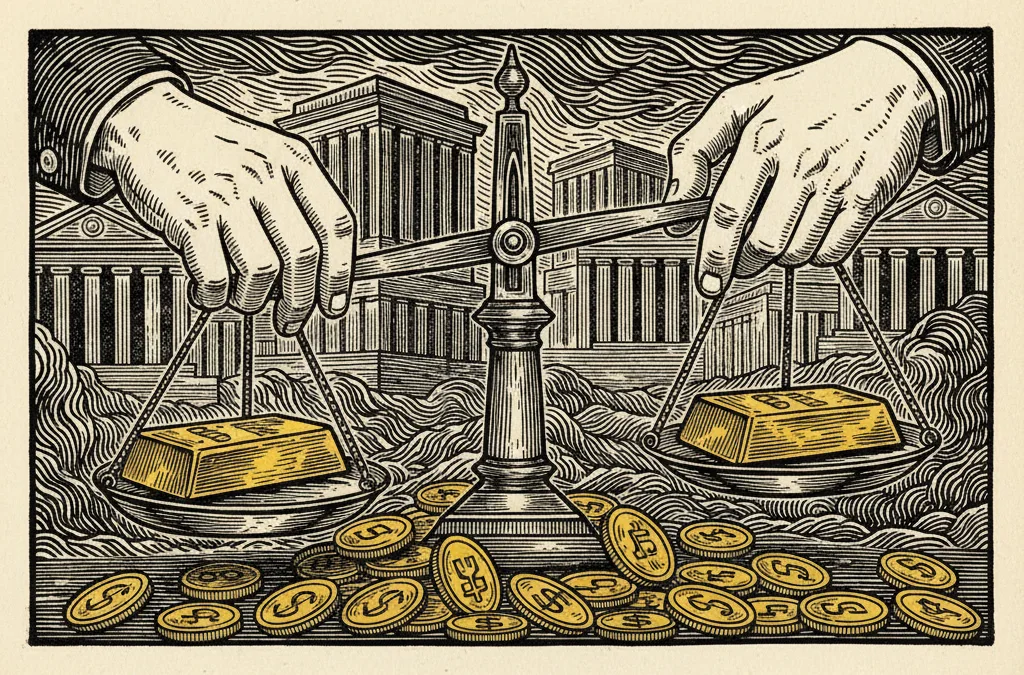
Gold is trading at $5,115.80/oz after a volatile month that saw prices swing between $4,847 and $5,405 - a range of over $550.
-
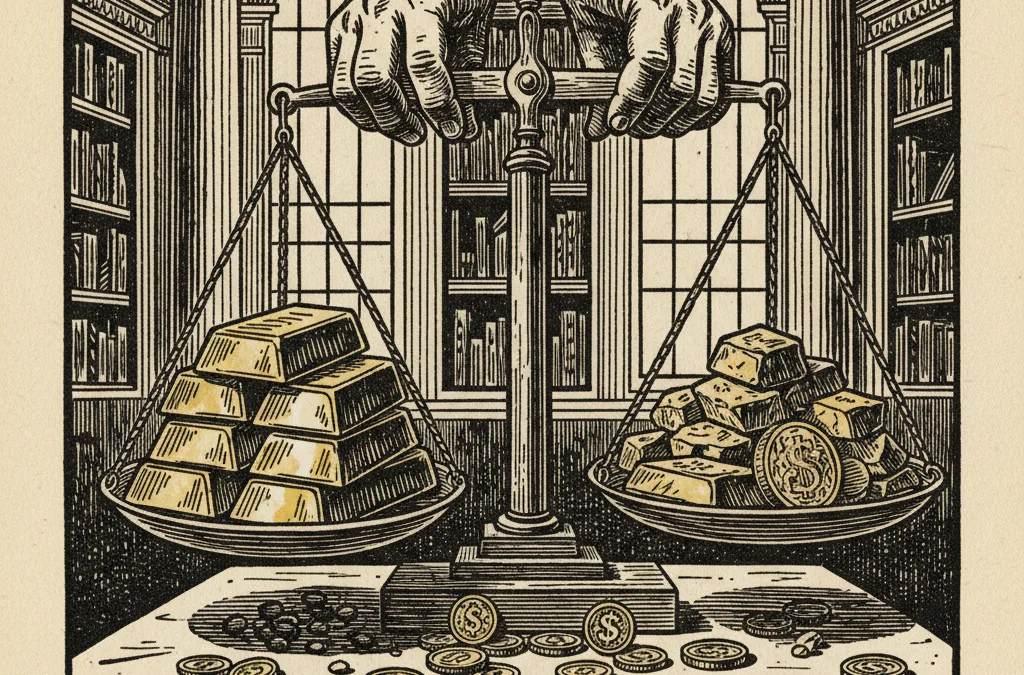
JP Morgan, ANZ, and HSBC have published notably divergent 2026 gold outlooks, reflecting fundamental disagreement on inflation trajectory and central bank policy.
-
The gold-to-silver ratio has compressed to 60.1, with silver surging 12.6% over the past month against gold’s 3.9% gain - a potential signal of broadening precious metals demand.
What happened
Gold is consolidating around $5,115 after a month that encapsulated everything about the current market’s split personality. The gold price touched $5,405 before pulling back nearly $290 - a 5.4% intra-month drawdown that would have been front-page news two years ago but barely registers in 2026’s volatility regime.
The widening gap between institutional forecasts is more telling than the price action itself. JP Morgan, ANZ, and HSBC have each laid out markedly different visions for where gold heads through the remainder of the year. The spread between the most bullish and bearish institutional targets has rarely been this wide, suggesting the macro backdrop is genuinely ambiguous rather than directionally clear.
This week’s US economic calendar - initial jobless claims, housing starts, building permits, and goods trade balance data all landing on the same day - adds another layer of near-term uncertainty. Labour market resilience and housing activity will feed directly into rate expectations, which remain the single most influential variable for gold positioning.
Who’s involved
The three banks represent distinct philosophical camps. JP Morgan has historically leaned into structural bull cases for gold, emphasising central bank accumulation and de-dollarisation trends that have accelerated since 2022. ANZ tends to anchor its analysis more tightly to real rates and dollar dynamics. HSBC, often the most conservative of the three on precious metals, typically weighs supply-side constraints and jewellery demand more heavily.
Beyond the sell-side, central bank buying remains the elephant in the room. Sovereign purchases have been a dominant force in gold’s march from $2,000 to $5,000 over the past three years, and any deceleration in that pace would remove a critical support pillar. Meanwhile, ETF flows have been mixed - institutional allocators appear to be trimming after the run past $5,000, while retail interest remains robust.
Silver’s outperformance is worth flagging here. At $85.09, silver has gained 12.6% over the past month versus gold’s 3.9%, compressing the gold-silver ratio to 60.1. This kind of silver leadership often signals that industrial demand narratives are gaining traction alongside monetary metal flows - a broadening that tends to support the entire complex.
Why it matters
When major banks disagree this sharply, it typically reflects a market at an inflection point rather than a trending one. Gold’s 2023–2025 rally was characterised by unusual consensus - nearly everyone was bullish, and nearly everyone was right. That unanimity is breaking down.
The $5,000 level has become psychologically significant in much the same way $2,000 was in 2020–2023. Gold spent three years oscillating around $2,000 before decisively breaking higher. The question now is whether $5,000 becomes a new floor or merely a waypoint in a broader consolidation.
Volatility itself has become a feature, not a bug. The $550 monthly range represents roughly 11% of the current price - elevated by historical standards but consistent with what we’ve seen since gold accelerated past $4,000. For portfolio allocators, this changes the calculus around position sizing even if the directional thesis remains intact.
What happens next
Three things are on my radar. First, today’s US labour and housing data - any softness in jobless claims or building permits could reignite rate-cut expectations and push gold back toward the $5,200 handle. Second, the gold-silver ratio: a sustained move below 60 would suggest silver is entering a momentum phase that could pull the entire precious metals complex higher. Third, central bank purchase data for Q1 - if sovereign buying has slowed meaningfully from 2025’s pace, the structural bull case needs recalibrating.
The $4,847 monthly low is the line in the sand. A break below that level would mark the first lower low since November and shift the technical picture from consolidation to correction.
This article is for informational purposes only and does not constitute financial advice. Always do your own research before making investment decisions.